TL;DR
- Long production cycles drain cash. Use progress billing, supplier financing, and AI forecasting to align inflows with outflows.
- Inventory ties up cash. Implement Just-in-Time, demand-sensing AI, and consignment to reduce carrying costs.
- Delayed payments hurt. Offer early-payment discounts, use supply chain financing, and automate AR.
- Seasonal demand creates volatility. Build rolling forecasts, secure a line of credit, and diversify revenue streams.
- Labor costs add up. Use AI scheduling, cross-training, and contractor negotiations to control payroll.
Coimbatore, 2:47 PM. Arvind Kumar’s phone won’t stop buzzing. The production line at his auto components unit has ground to a halt again. The supervisor is yelling about a missing batch of steel bearings, the purchase guy is frantically calling three suppliers, all quoting 20% higher prices because it’s an “urgent” order. In the warehouse, Arvind finds ₹2.3 lakh worth of bearings expired, rusted, ordered six months ago “just in case.”
This is every Tuesday.
For owners and operations heads like Arvind, inventory forecasting is the difference between a calm Friday evening and a sleepless Sunday night explaining to the founder why a ₹12 lakh order is delayed over ₹18,000 worth of missing nuts and bolts. It’s the invisible hand that either accelerates your growth or quietly erodes your margins, one miscalculated purchase order at a time.
Most manufacturing SMEs bleed because of bad inventory math. The kind of math that traps working capital, stops production lines, and turns warehouses into expensive graveyards of “just in case” stock. This is the story of how inventory forecasting became the single most important daily decision for Indian manufacturers and how to get it right without becoming a data scientist.
Why Inventory Forecasting Is the One Number That Decides Your Month
Let’s cut through the theory. Inventory forecasting, for a manufacturing SME, answers one simple question: How much raw material do I need to buy this week so production runs smoothly without locking up all my cash?
That’s it. No complex algorithms. No five-year trend analysis. Just a reliable number that lets you sleep at night.
The cost of getting it wrong
When you overstock, you’re not just wasting warehouse space. You’re:
- Locking up ₹5-15 lakh in excess inventory, which incurs 20-30% annual carrying costs, that’s an additional ₹1-4.5 lakh per year in warehousing, insurance, obsolescence risk, and capital costs. This working capital could have been used for salaries, machinery upgrades, or revenue-generating operations
- Paying 14-24% per annum in interest on working capital loans for SME manufacturers. Public sector banks like SBI and Canara Bank offer rates starting from 8-10% for top-rated borrowers, but most Tier 2/3 SMEs with moderate credit ratings face 14-22% from NBFCs and private lenders
- Watching inventory turn into dead stock and research shows that even well-run manufacturing companies can find 20-30% of their inventory is dead or slow-moving stock. Healthy businesses aim to keep dead stock below 5-10%, but poor forecasting and inventory management can push this to 20-30% or higher
When you understock, the math is even more brutal:
- One production stop can cost small and medium manufacturing units anywhere from ₹25,000 to ₹1.5 lakh per hour, depending on the industry and scale. For automotive component manufacturers, the cost averages ₹1-1.5 lakh per hour, while for food processing units it can be ₹25,000-50,000 per hour. Even for smaller operations, 30 minutes of downtime across 20 machines can quietly drain ₹15,000
- Rush orders from suppliers typically cost 25-100% more depending on urgency. For same-day or 24-hour delivery, premiums can reach 100%, while 48-72 hour rush jobs typically add 25-50% to standard pricing. This doesn’t account for the hidden costs: disrupted production schedules, overtime wages, express shipping, and increased error rates from rushed work
- Customer churn: When you delay delivery twice, your customer starts calling your competitor. No discount can win them back
For a ₹2 crore revenue manufacturing SME with ₹40-50 lakh in average inventory, the combined cost of poor inventory management can reach ₹15-22 lakh annually.
Here’s the breakdown:
- Inventory carrying costs: 20-30% of inventory value annually = ₹8-15 lakh
- Dead stock write-offs: 20-30% of inventory becoming obsolete = ₹8-15 lakh one-time loss
- Production downtime: 2-3 unplanned stoppages per month at ₹25,000-50,000 each = ₹6-18 lakh annually
- Rush order premiums: 5-10 emergency orders per year at 50% premium = ₹2-5 lakh annually
For an SME operating on 8-12% net margins, this ₹15-22 lakh annual leakage can completely erase profitability
A day in the life of a founder stuck in inventory guesswork
Arvind’s morning ritual tells the story better than any consultant’s report. He wakes up, grabs his phone, and texts three people:
- Stores: “What’s the RM stock?”
- Purchase: “Which POs are pending?”
- Production: “Any material issues today?”
The answers come back as three different Excel sheets, two WhatsApp voice notes, and one “Sir, I’ll check and come back.”
By 11 AM, he’s already made three decisions based on gut feel:
- Order 500 kg of steel “just to be safe”
- Delay a non-critical order because “we’re probably low on something”
- Promise a customer delivery date based on “last time it took about 10 days”
This is forecasting by intuition and it’s costing him ₹1.5 lakh every month in either excess stock or emergency purchases.
What Inventory Forecasting Means for an SME (Not the MBA Version)
Let’s retire the textbook definition. For you, inventory forecasting is knowing what to buy, how much to buy, and when to buy based on what your factory actually needs, not what you hope will happen.
The 3 numbers that matter
Forget complex models. You need three numbers every Monday morning:
- What’s my real-time consumption rate?
Not last month’s average. Last week’s actual usage on the shopfloor. - What’s my supplier’s real lead time?
Not the 7 days they promise. The 12 days they actually take, including their delays. - What’s my safety buffer?
Not “2 months stock.” The exact number of days that covers you when your best supplier suddenly goes silent.
That’s it. Everything else is noise.
Where forecasting lives in your factory
Forecasting isn’t a back-office finance activity. It lives in three places:
In the shopfloor supervisor’s pocket: He logs daily consumption on a simple mobile app, it takes 3 minutes and gives you live data.
In the purchase manager’s morning call: Instead of asking “What should I order?” he asks, “The forecast says we need 300 kg by Friday. Can you confirm?”
In the founder’s cash flow meeting: When Rajesh asks, “How much cash do we need next month?” you say, “₹4.2 lakh for inventory, based on the forecasted production plan.”
This is forecasting that talks like you do, numbers that make decisions obvious.
Why SMEs Keep Getting Forecasting Wrong (Even the Smart Ones)
Bad forecasting isn’t about bad math. It’s about bad inputs. And the causes are so embedded in daily operations that most owners never spot them.
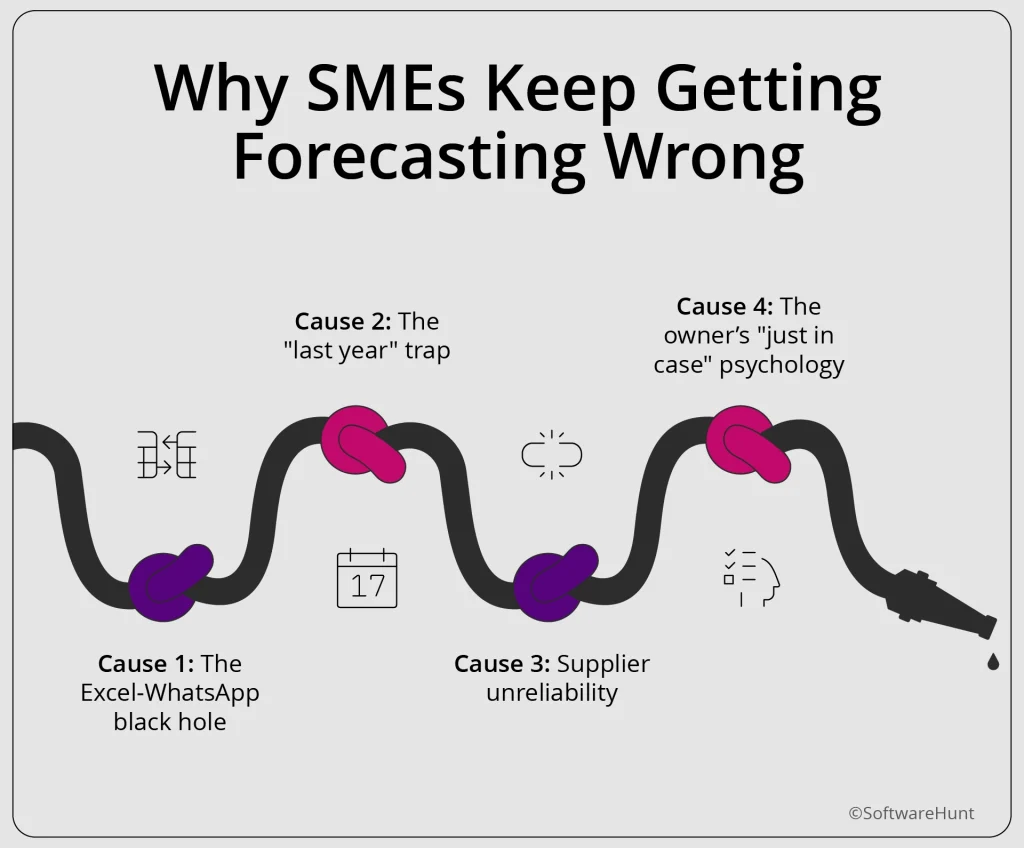
Cause 1: The Excel-WhatsApp black hole
Your data lives in five places:
- Tally (the “official” numbers)
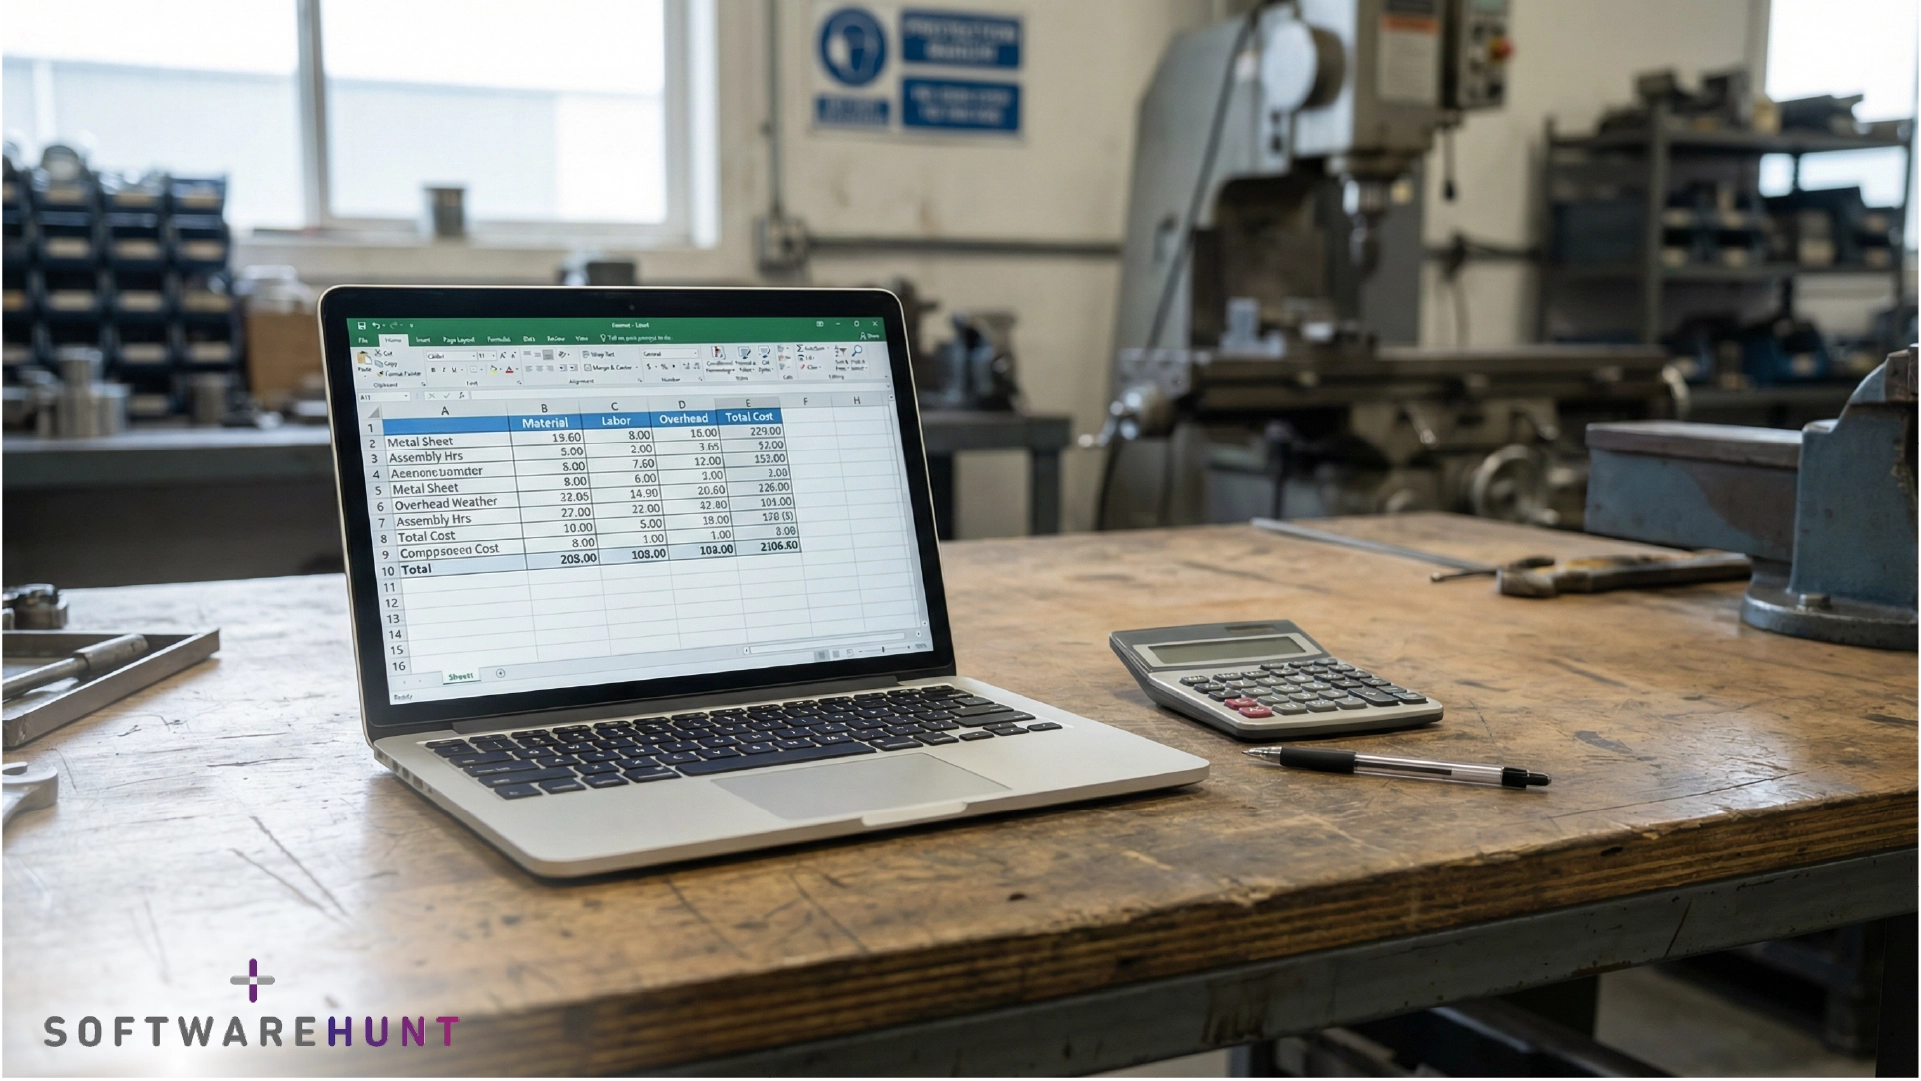
- Excel (the “working” numbers)
- WhatsApp (the “real-time” updates)
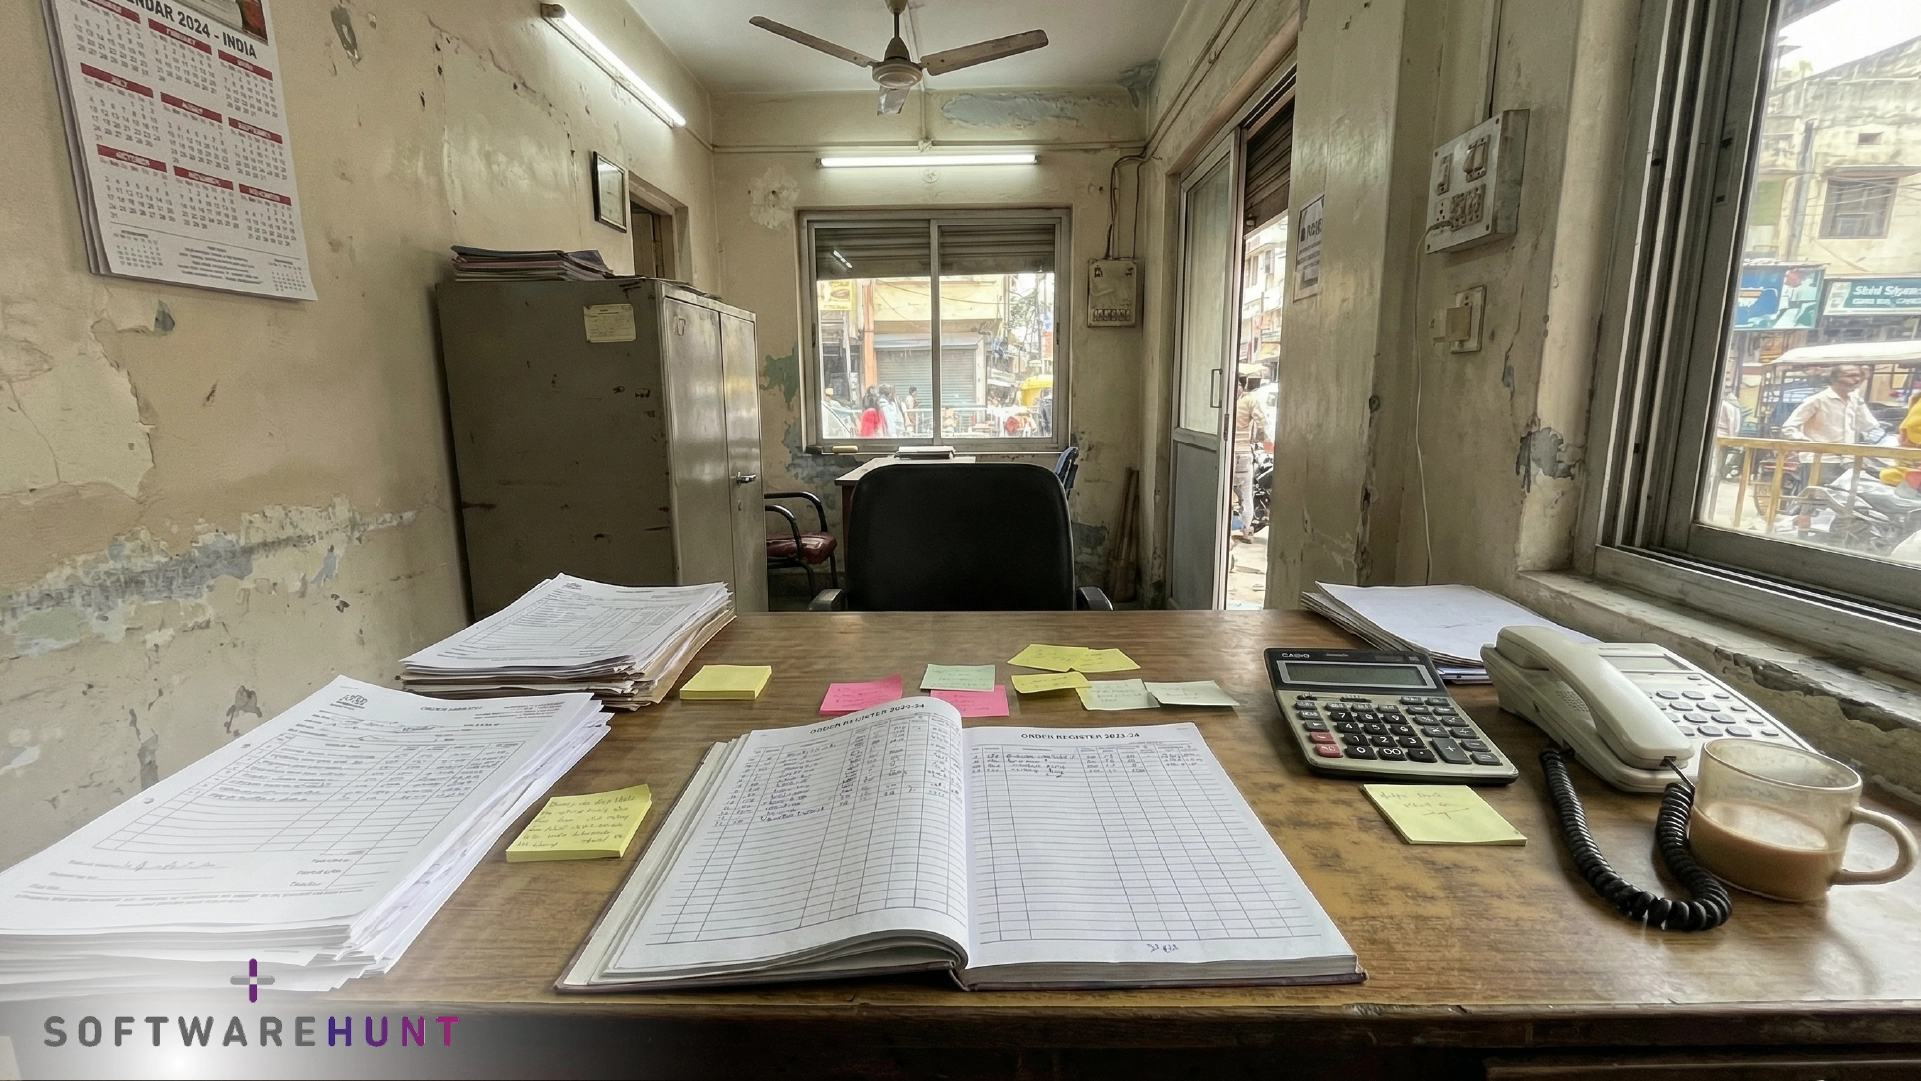
- Paper registers (the “backup” records)
- Someone’s memory (the “trust me” numbers)
They never match and you’re supposed to forecast from this?
Excel works well for simple scenarios. With 50 SKUs, 3 suppliers, and stable demand, you get a tool that’s fast, familiar, and free.
But manufacturing forecasting at scale needs different capabilities. Excel works for 50 SKUs with stable demand. Beyond 200 SKUs with multi-level BOMs and multiple editors, you need purpose-built tools for real-time collaboration, automatic alerts, and audit trails that Excel can’t provide.
At that scale, problems compound. Formula errors spread across linked sheets. Files with 5MB+ data take 30 seconds to open. One accidental delete wipes out months of consumption history. Macros break when someone updates their Excel version. There’s no audit trail showing who changed what and when.
Excel works beautifully for what it was designed to do. Manufacturing forecasting with 200+ SKUs, multi-level BOMs, and 10+ suppliers requires purpose-built tools.
When SMEs say Excel doesn’t work anymore, they mean they’ve outgrown the tool’s design limits.
Forecast accuracy suffers dramatically when data lives in fragmented systems. Industry research shows that:
- Food & Beverage: Median forecast error ~25%, with poorly managed operations reaching 40-50%
- Durable consumer products: Forecast error rates can reach 50% due to data silos, inconsistent ERP inputs, and external volatility
- Retail/D2C: 58% of brands report inventory forecast accuracy below 80%
- Variable-demand products (ERRATIC/LUMPY categories): Forecast error of 20-60% is common due to bias and data quality issues
Organizations that break down data silos and implement unified forecasting platforms see 15-25% improvement in forecast accuracy.
Cause 2: The “last year” trap
Most forecasting advice says: “Look at historical data” but for a growing SME, last year’s numbers are obsolete. You added two new product lines, switched suppliers, and hired 15 new workers. Last year’s consumption pattern is as relevant as a flip phone.
The reality for Tier 2/3 SMEs: You need forecasting that works with 3-6 months of recent data, not 3 years of ancient history. The tool must be agile, not archival.
Cause 3: Supplier unreliability
Your supplier says 7 days but sometimes it’s 5, sometimes it’s 15. During monsoon, it’s 21. During festival season, he disappears for 10 days.
Traditional forecasting models assume consistent lead times. Indian SME forecasting must assume chaos. The best model isn’t the one that’s mathematically perfect. It’s the one that builds in maximum lead time variance, not average.
Cause 4: The owner’s “just in case” psychology
The founder says, “Order extra. We can’t afford a stockout” so you overstock, then finance says, “Why is ₹8 lakh sitting in inventory?” so you understock next month. The oscillation creates a bullwhip effect that no spreadsheet can tame.
Forecasting fails when it’s overridden by fear. The system must give the owner visible confidence that the forecasted number is safe. That’s why peer proof and safety stock transparency are non-negotiable.
Not All Stock Is Equal: The 3 That Make or Break Your Cash
Safety Stock vs Overstock: The Line Most Owners Don’t See
Safety stock is insurance. It covers supplier delays and demand spikes.
Overstock is waste. It’s the inventory you bought because you guessed wrong.
Example:
Rajesh holds 350 kg of bearings as safety stock (calculated based on max lead time variance). That’s smart.
He also holds 800 kg of a specialty coating he ordered 6 months ago because ‘the price was good.’ That’s overstock. It ties up ₹2.3L and he has no confirmed order for it.
The difference? Safety stock has math behind it. Overstock has hope.
You can’t forecast what you can’t see and most SMEs are blind to three critical inventory categories:
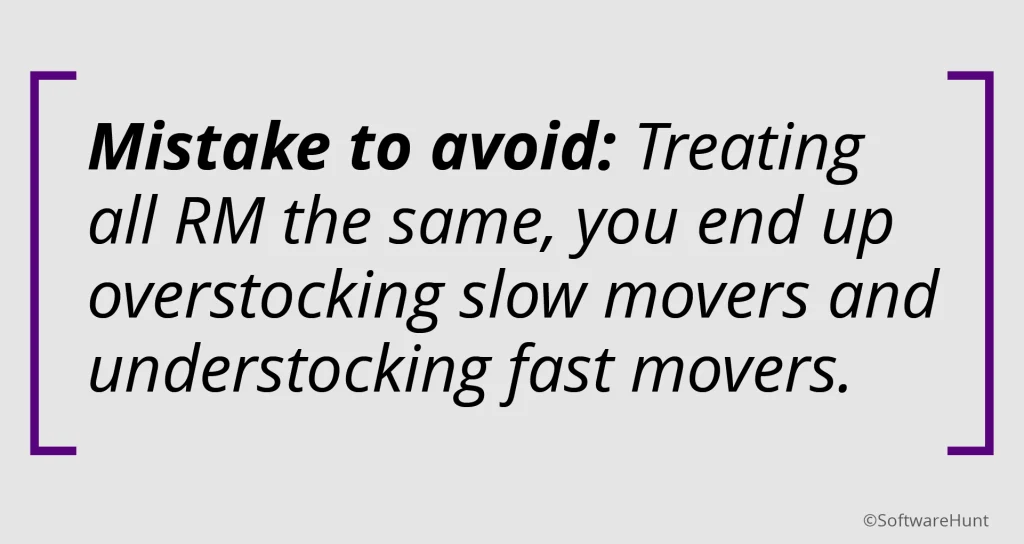
Type 1: Raw material (RM) that actually moves
Not all RM is equal. Track these three buckets:
- Fast movers: Consumed daily (e.g., steel sheets, bearings). Forecast weekly. Safety stock: 7 days
- Medium movers: Consumed weekly (e.g., specialty paints). Forecast bi-weekly. Safety stock: 15 days.
- Slow movers: Ordered monthly or for specific jobs. Don’t stock them. Order only when PO is confirmed.
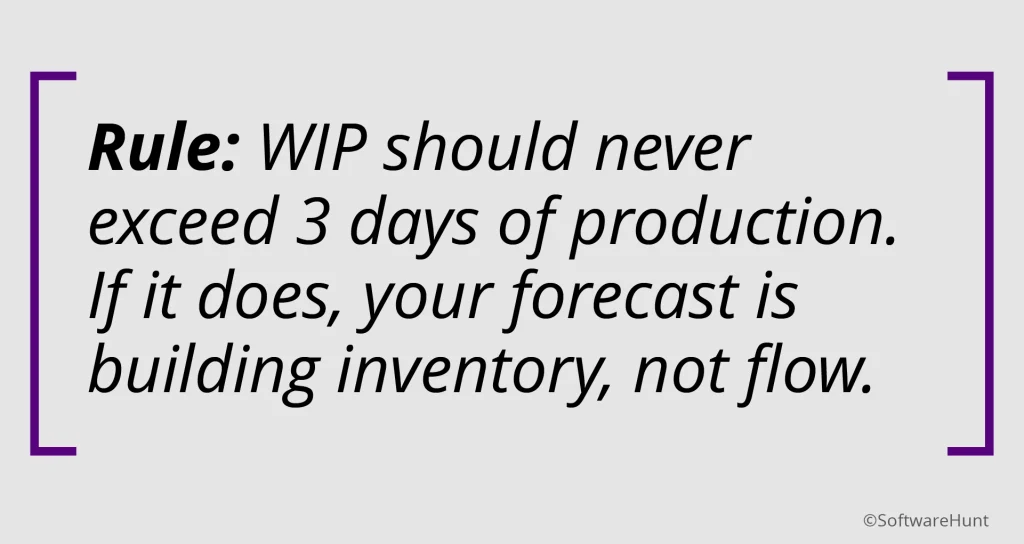
Type 2: Work-in-progress (WIP) that’s hiding problems
WIP is your canary in the coal mine. If WIP is piling up between machines, your forecast is wrong. You’re producing parts that aren’t needed yet, while starving other lines.
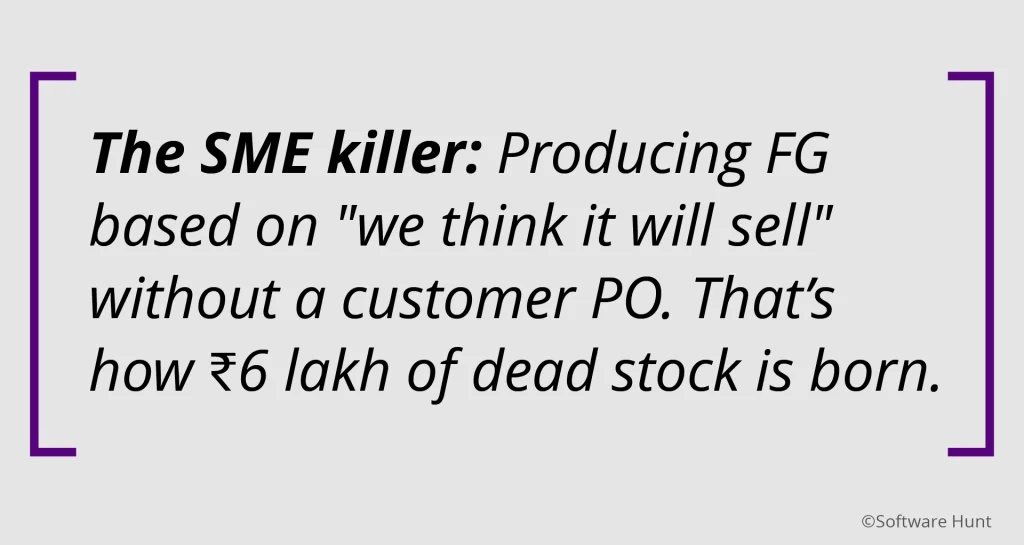
Type 3: Finished goods (FG) that’s eating cash
FG is the most expensive inventory. It has labor, overhead, and material locked in. Every day it sits, it bleeds value.
Forecast FG based on:
- Confirmed orders (80% of your forecast)
- Historical monthly sales pattern (15%)
- “Hope” (5%, but keep it separate so you can track how wrong you were)
The BOM Trap: Why Forecasting One Finished Good Means Forecasting 15 Raw Materials
Manufacturers don’t forecast one number. They forecast 15 numbers that must arrive together.
Arvind forecasts 100 gear assemblies for next month. His BOM requires per unit:
- 1 steel shaft (7-day lead time, Pune supplier)
- 4 bearings (15 days, Rajkot)
- 8 bolts (3 days, local)
- 2 seals (21 days, Mumbai)
- 1 housing (10 days, Coimbatore)
For 100 assemblies, he needs 100 shafts, 400 bearings, 800 bolts, 200 seals, and 100 housings.
Three ways to handle this:
Order everything to arrive on Day 21. Bolts sit idle for 18 days, shafts for 14 days. You pay 16-22% annual interest on ₹2.5 lakh doing nothing. That wastes ₹8,000-11,000.
Order each component just-in-time. If the seal supplier delays by 3 days, 100 assemblies sit incomplete. Your customer order stalls. You pay ₹50,000 in liquidated damages.
Stagger orders by lead time. Order seals on Day 0, bearings on Day 6, housings on Day 11, shafts on Day 14, bolts on Day 18. Everything arrives between Day 21-23. Add a 2-day buffer for seals and bearings since they drive the timeline.
Why Excel breaks here:
You’re actually tracking 100 finished goods times 15 components each, which equals 1,500 SKUs. Each has different lead times ranging from 3 to 21 days, different suppliers (10+ vendors), and different minimum order quantities. Excel can’t handle real-time updates from multiple people, automatic reorder alerts, or multi-level materials planning at this scale.
When you forecast one finished good, you’re forecasting 15 raw materials with different timing requirements that depend on each other arriving together. This is multi-level materials planning, which needs purpose-built tools beyond spreadsheet math.
3 Forecast Hacks You Can Implement by Friday
Here are three methods you can implement by Friday:
Method 1: The moving average over three months (for steady demand)
When to use: For things that are used every month (like packing material or standard fasteners).
How it works:
Take the last three months of consumption: In the first month, 500 kg, in the second month, 520 kg, and in the third month, 510 kg
510 kg is the average of 500, 520, and 510.
That’s what you think will happen next month.
Improvement: If your business is growing by 10% every three months, add 10% to the average: 510 kg plus 51 kg equals 561 kg.
It takes 10 minutes on a calculator or 2 minutes if your tool does the math for you.
Method 2: Adjusting for the seasons (for spikes that can be predicted)
Use this when demand follows seasonal patterns, like during the holidays, the monsoon, the harvest, the start of school, the end of the financial year, or the end of the school year.For example, Arvind makes office and school supplies.
Demand in August (back-to-school season) over the past three years:
- 2,200 units in 2023
- 2,400 units in 2022
- 1,900 units in 2021
The average is 2,167 units.
The average number of units sold each month is 1,100.
A simple moving average over three months would predict 1,100 units for August 2024. But the spike is because of seasonal adjustment: 2,167 units times 1.1 growth factor equals 2,384 units.Preparing for the spike:
His single-shift capacity is 1,200 units per month.
2,384 units were needed in August.
Shortfall: 1,184 units
Three choices:
- Add a second shift (capacity goes up to 2,400) and send 184 units out to other companies.
- Make 150 more units each month in June and July to build up a buffer.
- Accept partial fulfillment (deliver 2,200, lose 184 orders)
The buffer strategy was chosen by Arvind. He made 1,250 units in June and July, which is 150 more than the usual 1,100 units each month.
He had 300 buffer units ready by August 1. He met the demand for 2,384 units without working extra hours or hiring outside help, thanks to production in August.
The numbers: ₹2.8 lakh in revenue. Holding cost for the buffer for 60 days: ₹12,000. The net benefit is ₹2.68 lakh.
Shortcut for small amounts of data: Add your growth rate to the same month last year. If you sold 30% more last monsoon than in normal months, add 30% to this monsoon’s forecast.Time needed: 15 minutes each season, then set it up to run on its own.
Method 3: Prediction based on judgment (for new products)
Use this when you want to launch a new product, enter a new market, or when you don’t have any historical data.Put together three pieces of information: data from customer inquiries, industry benchmarks, and the founder’s gut feeling.For example, Arvind sells LED light panels for businesses.
Step 1: Figure out from questions
Questions from customers in the last 60 days: 60% of B2B leads turn into customers (the industry average is 10–15%).A conservative guess of 12% means that 60 × 0.12 = 7 expected orders.
Step 2: Put in a buffer
Forecast for the first month: 12 units (7 expected plus a 70% buffer for things we don’t know)
Step 3: Get a lot of stock at first
Safety stock for the first three months: 100% of the forecast (stock 24 units if the forecast is 12)Why did you overstock at first? When you run out of stock on a new product, it costs more to lose a customer’s trust than it does to keep a few extra units for 60 days.Step 4: After 90 days, go to data
After three months, the actual sales were 9, 11, and 8 units, or an average of 9.3 units per month.Starting in month four, use the 3-month moving average (9.3 units) and cut safety stock by 30%.The rule: Keep too much stock for 90 days on purpose while you learn how demand changes. After that, have faith in the data.Setting up takes 20 minutes, and then reviews happen every three months.
What the Best-Run Factories Do Differently
These are what successful SMEs in Tier 2/3 cities do daily.
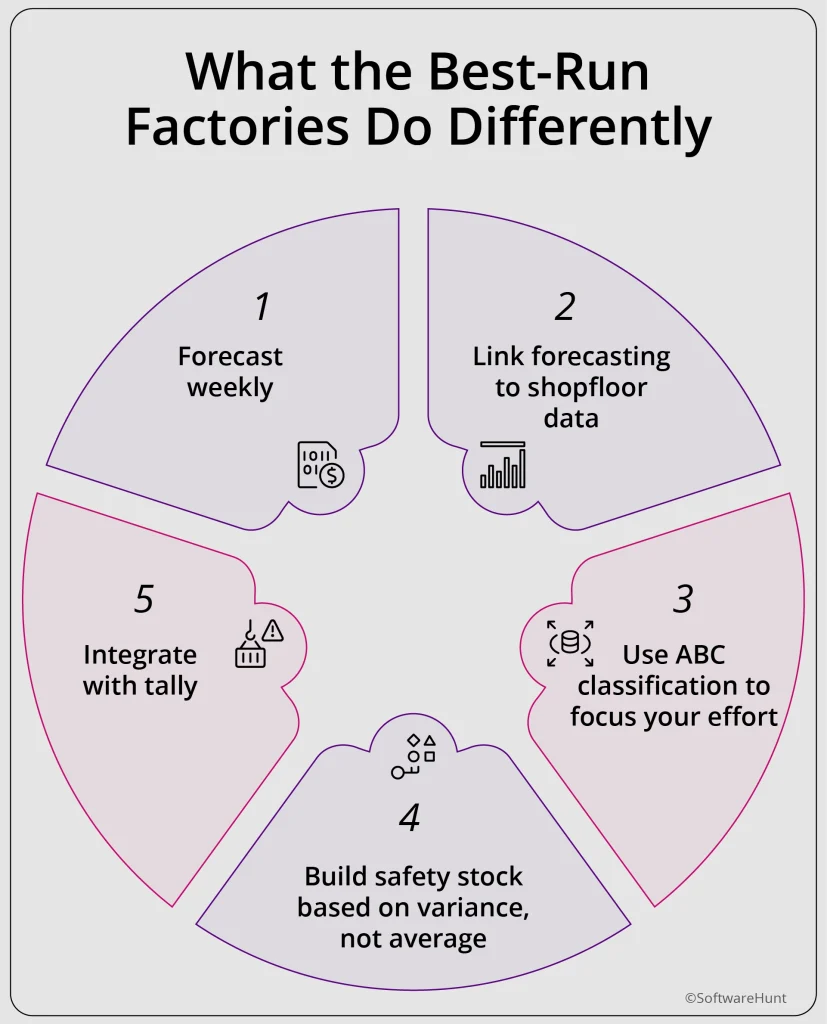
Practice 1: Forecast weekly
Monthly forecasting is too slow. By the time you spot a trend, you’re already in crisis.
Weekly rhythm:
- Monday 9 AM: Review last week’s consumption vs. forecast. Adjust next week’s forecast.
- Wednesday 11 AM: Check supplier lead time status. Confirm POs for next week.
- Friday 4 PM: Quick huddle with stores and purchase. Any surprises for next week?
Time investment: 45 minutes per week. ROI: 30-50% reduction in stockouts.
Practice 2: Link forecasting to shopfloor data (not just excel)
The forecast is only as good as the data feeding it. Your shopfloor supervisor must log daily consumption in real-time.
Low-tech version: A shared Google Sheet on a tablet, supervisor enters end-of-shift numbers, it takes 3 minutes.
High-tech version: Mobile app with barcode scanning, scan RM issued to production, and forecast auto-updates.
Key: Make data entry easier than his current WhatsApp update. If it takes longer, he won’t do it.
Practice 3: Use ABC classification to focus your effort
You can’t forecast everything perfectly. Forecast the 20% of items that make up 80% of your inventory value.
How to ABC classify:
- A-items: Top 20% by value. Forecast weekly. Safety stock: 7 days.
- B-items: Next 30% by value. Forecast bi-weekly. Safety stock: 15 days.
- C-items: Bottom 50% by value. Forecast monthly. Safety stock: 30 days (or none, order JIT).
Result: You spend 80% of your forecasting energy on the items that actually matter.
Practice 4: Build safety stock based on variance, not average
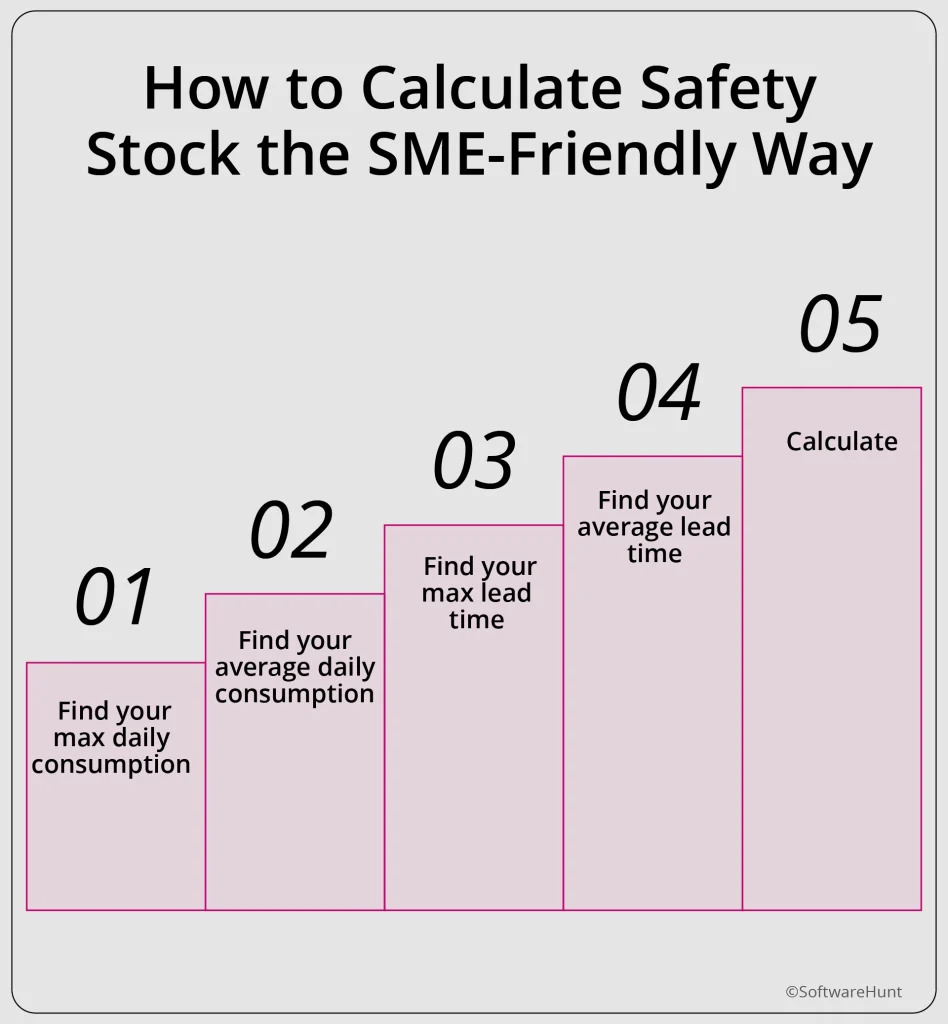
Safety stock = (Max daily usage × Max lead time) – (Average daily usage × Average lead time)
Example:
- Average daily usage = 20 kg
- Max daily usage (peak day) = 35 kg
- Average lead time = 7 days
- Max lead time (worst case) = 14 days
Safety stock = (35 × 14) – (20 × 7) = 490 – 140 = 350 kg
This covers you for the worst-case scenario.
Practice 5: Integrate with tally (the non-negotiable)
If your forecasting tool doesn’t sync with Tally, it’s a non-starter. Period.
What good integration looks like:
- RM consumption from shopfloor → auto-updates Tally stock journals
- Forecasted POs → appear in Tally as “draft POs” for finance approval
- Actual POs raised in Tally → reflect in forecasting tool for tracking
Seeing these forecasting challenges in your factory?
We’re SoftwareHunt. Our team sits with manufacturing owners to understand your operational leaks and growth challenges. We go beyond platform listings to help you find the right solution at no cost to you.
To email an advisor for a quick fit-check write to us at connect@softwarehunt.com
If You Want to Level Up, Here Are the Models That Won’t Fail You (The SME Toolkit)
Model 1: The rolling forecast (agility over accuracy)
Instead of a fixed monthly forecast, update every week based on new data.
How it works:
- Week 1 forecast: Based on last 3 months
- Week 2: Adjust based on Week 1 actual consumption
- Week 3: Adjust based on Week 2
Benefit: You’re never more than 7 days off reality. For SMEs, agility beats perfect accuracy.
Model 2: The demand-driven forecast
Base your RM forecast on confirmed orders + high-probability inquiries, not on capacity.
How it works:
- 70% of forecast = Confirmed POs from customers
- 20% = Inquiries that are 80% likely to convert (based on historical conversion rate)
- 10% = Historical baseline for “walk-in” orders
This prevents: Producing FG that nobody ordered. The #1 cause of dead stock.
Model 3: The hybrid model (simple + smart)
Combine simple moving averages with one “smart” factor: supplier reliability.
Formula:
Forecast = (3-month moving average) + (Safety stock based on max lead time variance)
Why it works: It’s 80% simple math, 20% smart insurance. Perfect for SMEs that can’t run complex models but need to survive supplier chaos.
Checklist: What a Good Inventory Forecasting System Must Have (Your Evaluation Scorecard)
Before you demo any forecasting tool, run it through this checklist. We’ve seen dozens of manufacturers waste 3-6 months implementing tools that don’t sync with Tally or capture shopfloor data. This scorecard prevents that.
Score each feature 1-5 (5 = excellent). Total score below 30? Walk away.
| Feature | Why It Matters for SMEs |
| Tally Integration | The finance head (Anil) won’t approve without it. Must sync stock, POs, invoices bidirectionally |
| Mobile App | The shop floor supervisor won’t use the desktop. App must work offline, sync when online |
| Simple Forecasting Model | 3-month moving average, seasonal adjustment, safety stock. No ARIMA, no jargon |
| Supplier Lead Time Tracking | Captures actual delivery days, not promised. Shows variance |
| Safety Stock Calculator | Auto-calculates based on max usage/max lead time. Shows number, not formula |
| Real-Time Dashboard | Shows RM stock, WIP, FG, reorder alerts in one screen. Updates every 2 hours |
| Low Data Requirement | Works with 3-6 months of data, not 3 years. AI/ML for sparse data |
| Local Language Support | App interface in Tamil/Telugu/Kannada. Training videos in local language |
| Quick Implementation | Up and running in 3-4 weeks. Pilot on one product line first |
| Transparent Pricing | Monthly subscription, no hidden costs, cancel anytime. Under ₹15K/month for SMEs |
| Case Studies | Shows peer manufacturers in Tier 2 cities, similar size, similar pain |
Total Score: ___ / 60
Interpretation: 45+ = Strong fit. 30-44 = Maybe, but negotiate hard. Below 30 = Keep searching.
Your Next Move: The 5-Minute Diagnostic
Stop reading about forecasting.
Stop planning to start.
Start today.
Forecasting is never perfect, but bad forecasting is always expensive.
The gap between 70% accurate forecasts and 40% guesses costs ₹12-15 lakh annually in working capital waste, stockout-driven production stops, and emergency purchases at 50-100% premiums. Research shows manufacturers pay through excess inventory, stock shortages causing delays, overtime or idle capacity, and missed revenue when supply can’t meet demand.
You don’t need perfection. Improving from 40% to 60% accuracy can save a ₹2 crore SME upwards of ₹8 lakh annually. Studies show that better forecasting reduces inventory by over 15%, improves service levels by more than 10%, and increases gross margins by 3-5%.
Start with one method. Track for 4 weeks. Adjust. Repeat.
We’re SoftwareHunt. We work with manufacturing owners running on Tally, Excel, and lean teams to understand your operational leaks and growth challenges. We go beyond platform listings to help you find the right solution at no cost to you.
Most manufacturers struggle with forecasting not because they lack tools, but because they haven’t diagnosed where the planning actually breaks. Our team sits with you, maps your specific challenges, and helps you find the right fix – whether it’s a simple process change or the right software.
To email an advisor for a quick fit-check write to us at connect@softwarehunt.com