TL;DR
- Your factory looks busy, but preventable order errors and returns are quietly burning several lakhs a year in freight, rework, and discounts.
- Most issues start with messy order capture across WhatsApp, emails, and PDFs that lets wrong specs, quantities, or addresses slip through.
- Each bad order triggers firefighting – rescheduling, overtime, and rework – stealing capacity from new, profitable orders.
- Measuring Perfect Order Rate and cost per error shows exactly where you’re leaking cash so you can fix the right stage first.
Munters Group, a company that makes climate control equipment all over the world, had a problem that kept getting worse and worse, which hurt their profits.
Sales teams, distributors, and direct emails all sent in orders. Each one needed to be entered by hand into production systems. Even with careful typing, the “human bridge” made mistakes that happened over and over again, like wrong specs, wrong amounts, and delivery dates that didn’t match.
Things were very messy on the factory floor. “Urgent corrections” made production schedules change all the time. The workers didn’t believe the demand forecast.
The problem started with the design of the process.
Accuracy went up a lot when Munters set up a system where buyers could place orders directly. People who work in manufacturing said, “Fewer change orders… because the buyer is the one actually placing the order.”
This case shows the most important truth: Getting orders right is a way to make money. Your factory looks busy on paper. In reality, you are losing money because of unnecessary rework.
Why India’s E-Commerce Has a Crisis
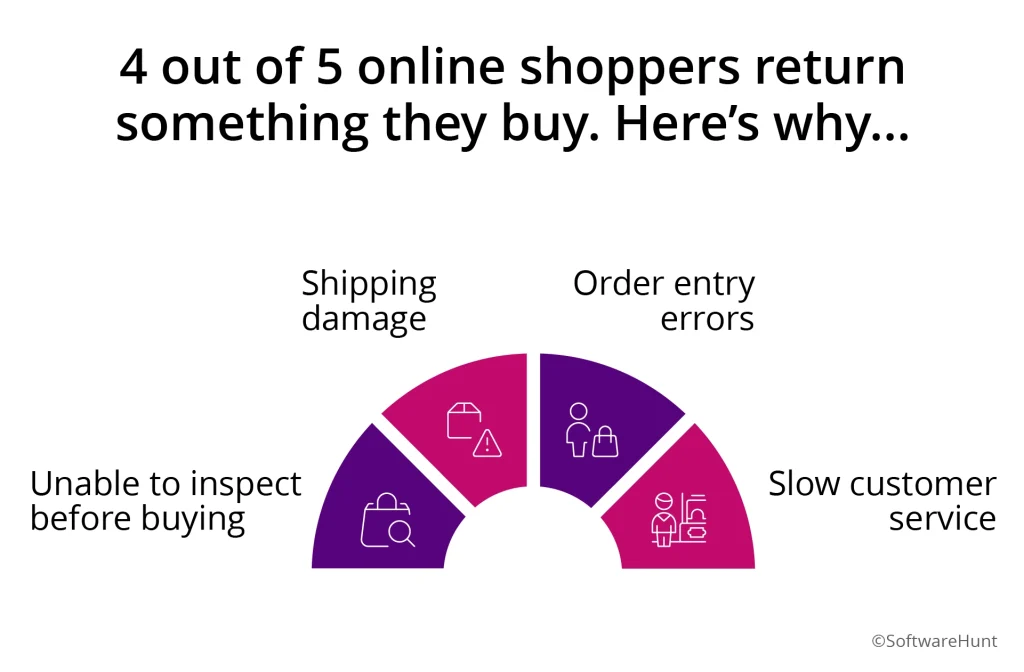
E-commerce return rates are significantly higher than brick-and-mortar retail globally. In 2024, the US e-commerce average return rate reached 16.9%, with online-specific purchases hitting 24.5%.
In India, the challenge is amplified by:
- Logistics Damage: Packages often pass through 3+ warehouse checkpoints. Each touchpoint increases damage risk.
- Order Accuracy Impact: McKinsey research shows that consistent, error-free experiences can lower the cost of serving customers by as much as 20%.
What Order Errors Actually Feel Like Inside Your Business
Manufacturers rarely sit down and say, “We have an order accuracy problem.” What you feel day‑to‑day is chaos.
1. The “Human Bridge” Between WhatsApp and the Shop Floor
Orders arrive through:
- Sales reps on WhatsApp and phone calls
- Distributors sending PDFs and email POs
- Marketplace portals, your own website, walk‑in dealers
Somebody on your team has to translate all of that into your internal system.
That person is the “human bridge” between customer demand and production reality. When they get it wrong, just once, you see:
- Wrong spec: 3‑phase motor instead of single‑phase
- Wrong variant: Old model shipped instead of the new one
- Wrong quantity: 10 cartons instead of 1, or 1 instead of 10
- Wrong date: Customer expected dispatch on 5th; you scheduled for 15th
2. A Single Wrong Order Costs Much More Than Freight
Most teams only see the courier bill when something comes back.
But a typical wrong or damaged order quietly piles up cost into five buckets:
- Return freight: The courier brings it back.
- Replacement freight: You ship the right item again.
- Rework labour: Checking, unpacking, re‑labelling, repacking.
- Discounts / credit notes: “Sorry for the trouble, we’ll give you 10% off.”
- Admin time: Customer service calls, claim approvals, paperwork.
Even in a conservative Indian context, it’s easy to hit ₹700–₹1,200 per problematic order once you include internal labour and margin loss. Handle just 100 such errors a year and you’ve burned ₹1–1.25 lakhs and that’s at a modest error rate in a small operation.
None of this shows up clearly as “returns cost” on your P&L. It hides inside freight, discounts, overtime, and “miscellaneous.”
3. Returns Don’t Just Hurt Margins, They Erode Trust
Every wrong order is a small break in the relationship:
- A distributor wastes a day arguing with their own customer because you shipped the wrong batch.
- A D2C customer takes off work to receive a delivery… and opens the box to find the wrong size.
- A large buyer has to juggle their production because a critical component was mis‑picked.
Industry research consistently shows order errors are among the top causes of churn and poor customer experience. One inaccurate order can make customers 32% more likely to abandon your brand. Once they mentally label you as “unreliable to work with,” every future negotiation starts from a place of doubt.
You think you lost a customer because of pricing. Often, you lost them because of friction and embarrassment around fulfillment.
4. The Warehouse Lives in Firefighting Mode
On the shop floor and in dispatch, order inaccuracy doesn’t look like “a metric.” It looks like:
- Supervisors stopping a batch mid‑run because “we typed the wrong spec.”
- Last‑minute change requests that keep pushing regular orders down the line.
- Staff working overtime to re‑pick urgent replacements.
- Good workers getting blamed for mistakes that started at order entry.
Meanwhile, new orders pile up while your best people are busy fixing old ones. Each error ties up capacity that should have gone to fresh revenue, driving up lead times and delaying on‑time deliveries across the board.
Your factory feels busy. But a chunk of that “busyness” is just paid rework on avoidable mistakes.
5. E‑Commerce Returns Hit You Harder Than Retail Ever Did
If you sell D2C or via marketplaces, you already know this:
- Customers are far more likely to return online orders than offline ones.
- Recent data shows online return rates in the 20–25% range, compared to roughly 9% in stores.
- Categories like apparel, footwear, and parts see even higher returns because sizing and compatibility are tricky.
A significant portion of those returns aren’t “customer changed mind.” They’re accuracy and expectation problems:
- Address issues and failed delivery attempts (“Address not found”, “Customer unavailable”).
- Wrong item or variant shipped.
- Damaged in transit because of inappropriate packaging for the route.
- Delivery took so long the customer doesn’t want it anymore.
By the time that parcel finds its way back to your warehouse, you’ve paid:
- Outbound shipping
- Reverse logistics
- Handling and inspection
- Repackaging or write‑off if it’s unsellable
Why SoftwareHunt?
We’re SoftwareHunt. We work with manufacturing owners running on Tally, Excel, and lean teams to understand your operational leaks and growth challenges. Our team is happy to connect with you, understand your personal pain points, operational leaks and growth challenges and go beyond platform listings/information to help find the right solution for you.
We’ll help you translate symptoms into clear financial insight and show you where to focus first – at no cost to you.
To email an advisor for a quick fit-check write to us at connect@softwarehunt.com.
The Numbers Behind “Order Accuracy”
If you’re going to fix this, you need one simple, brutal lens: Perfect Order Rate.
A perfect order is one that is:
- Complete
- Correct
- On time
- Undamaged
Anything that fails, even one of these, is not a perfect order.
1. Perfect Order Rate
Perfect Order Rate = (Total Orders/ Perfect Orders) x 100
If you shipped 850 orders and 85 had any issue, your rate is:
- 850 − 85 = 765 perfect orders
- 765 ÷ 850 ≈ 0.9 → 90% Perfect Order Rate
Top performers in fulfilment run at 96–98% order accuracy. That last 6–8 %age points is often the difference between “constantly under margin pressure” and “quietly profitable.”
2. Annual Cost of Poor Accuracy
Use a simple model:
Annual Error Cost=(Total Orders)×(Error Rate)×(Cost per Error)
From your existing blog math:
Assume ₹975 per error once you include freight, labour, discounts, and admin.
So if you process 10,000 orders per year at a 1.5% error rate:
- Errors = 10,000 × 1.5% = 150
- Annual cost ≈ 150 × ₹975 = ₹1.46 lakhs
Increase the order volume or error rate slightly, and this quickly climbs into multiple lakhs per year. Many operations sit closer to 2–3% errors once you include “small issues” that never get formally logged.
What These Problems Look Like, Up Close
To make this real, here’s how manufacturers typically “feel” each root cause:
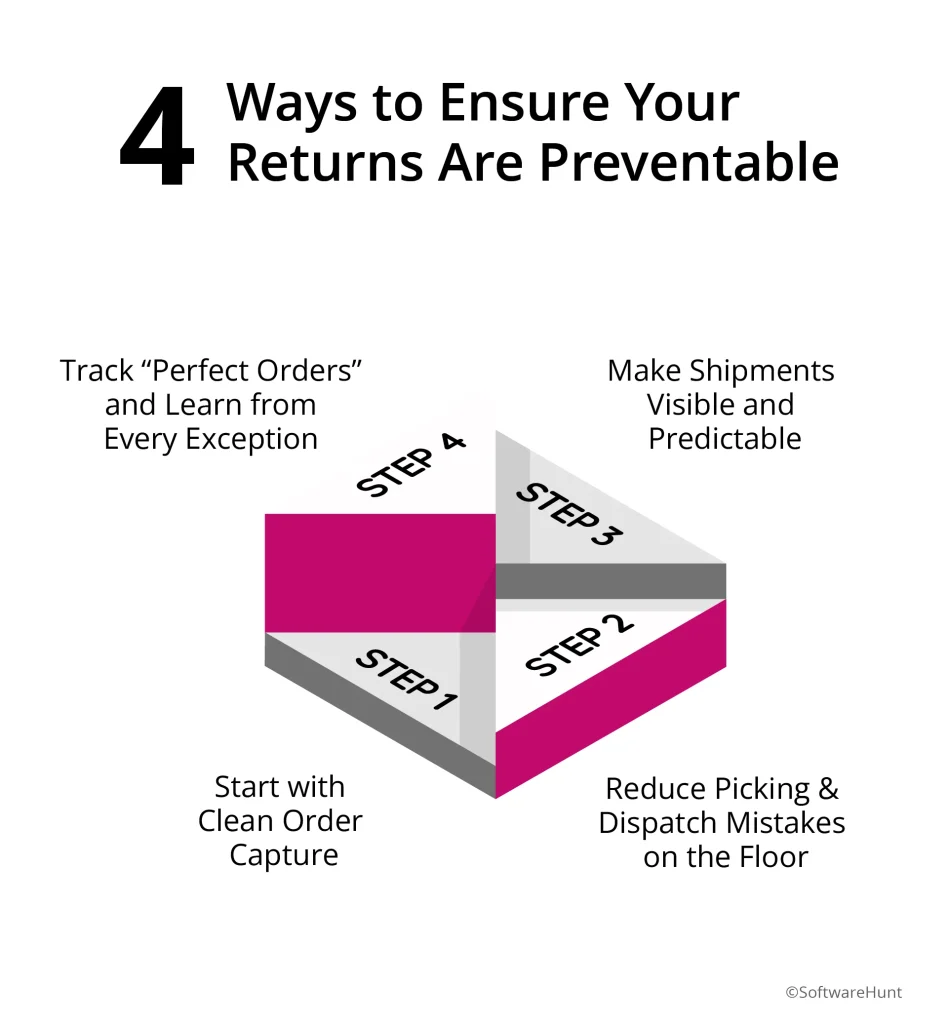
A. Dirty Order Capture
- Orders scattered across email, Excel, WhatsApp, calls.
- Sales reps promise one thing; the document says another.
- Distributors send POs in formats your team has to interpret manually.
- Nobody is fully sure which version is “final.”
Every manual interpretation step is a chance to get quantities, SKUs, addresses, or dates wrong.
B. Picking by Memory and Eye
- Teams work off printed pick lists and “know the products by sight.”
- After 20–30 minutes of intense picking, fatigue sets in and error rates climb.
- Similar‑looking SKUs (variants, sizes, shades) get mixed up.
- New staff rely heavily on others, increasing error rates during peak season.
Fulfilment studies show each picking error can cost up to $300 equivalent in returns and overhead in some markets, and can raise operational costs by 25%.
C. Blind Spots Between Dispatch and Delivery
- Customer calls: “Where is my order?” and your team has to manually track it.
- A shipment damaged at one of three hubs is only discovered when it hits the final customer.
- Address mistakes lead to RTO (Return to Origin), which now costs you 1.5x the original shipping cost in some Indian networks.
You don’t just lose money on that order, you lose customer patience.
D. No Feedback Loop on Returns
- Returns are handled ad hoc.
- Nobody is categorising: “Wrong item,” “Damaged,” “Late,” “Customer changed mind.”
- The same root causes repeat every month.
Industry data shows that companies which systematically analyse fulfilment errors see 20–30% lower service cost and better retention. Without that loop, you keep paying for the same mistake.
Where You Go From Here
You don’t need a giant transformation project. You need clarity about your biggest leak and a way to attack it without disrupting everything else.
Over the next 30 days, there are three hard questions to answer:
- What is your real Perfect Order Rate right now?
An honest count of orders with zero issues. - How much does a wrong order actually cost you?
Add up freight, labour, discounts, and unsellable stock for 10 recent returns. Then average it. - Which stage creates the most issues – capture, picking, packing, or last‑mile?
Look at 50 recent claims and classify each one by root cause.
Those three numbers will tell you:
- Whether your “order accuracy problem” is profit‑threatening.
- Whether to focus first on how orders are captured, how they’re picked, or how they’re tracked and analysed.
From there, the path forward becomes implementation, not guesswork.
Want Help Seeing the Pattern in Your Own Data?
Most manufacturers know returns are “high.” Very few can say:
- “Our Perfect Order Rate is 91%.”
- “Each error costs us about ₹1,050.”
- “42% of issues start at order capture, 35% at picking, 23% in transit.”
That’s what changes decisions.
Why SoftwareHunt?
We’re SoftwareHunt. We work with manufacturing owners running on Tally, Excel, and lean teams to understand your operational leaks and growth challenges. Our team is happy to connect with you, understand your personal pain points, operational leaks and growth challenges and go beyond platform listings/information to help find the right solution for you.
We’ll help you translate symptoms into clear financial insight and show you where to focus first – at no cost to you.
To email an advisor for a quick fit-check write to us at connect@softwarehunt.com.