TL;DR
- Payment delays aren’t just “waiting for money.”
- They cascade into five simultaneous profit leaks – working capital lockup, production disruptions, hidden labor costs, bad debt, and high-risk customer drag.
- Total of ₹8-15 lakhs annually for a typical ₹15-20 crore manufacturing business.
- Most founders have never calculated the true cost. The fix is measurable and achievable.
April 2025.
The MSME Samadhaan portal, India’s government platform for resolving delayed payment disputes, hit a grim milestone.
2,31,975 applications filed. ₹26,414 crore in pending dues.
57,433 applications hadn’t even been reviewed yet. Another 41,782 were “under consideration.”
The disposal rate? 10%.
This means for every 10 MSMEs filing complaints about delayed payments, only one was getting resolved.
The other nine were still waiting. Still chasing. Still bleeding cash.
And the volume was accelerating. FY25 saw a 94.1% increase in applications compared to the previous year. Over 47,000 new cases filed in a single year, chasing ₹8,024.9 crore.
The system designed to protect small businesses was drowning under the weight of the problem.
Basant Kaur from C2FO explained why MSMEs hesitate to even use the portal: “MSMEs hesitate to escalate disputes for fear of damaging commercial relationships.”
Translation: If you complain about Customer X not paying, Customer X might stop giving you orders entirely.
So you wait. You chase politely. You don’t escalate.
And while you wait, your cash flow strangles.
This is why 71% of Indian SMEs sought external funding in 2024, one-third just to stay afloat.
This is why businesses with ₹15 crore revenue struggle to make payroll on the 25th of every month.
This is why profitable companies run out of cash.
Because payment delays aren’t just “waiting for money.” They’re five simultaneous leaks draining ₹8 to ₹15 lakhs from your business every year without you realizing it.
Let me show you where it goes.
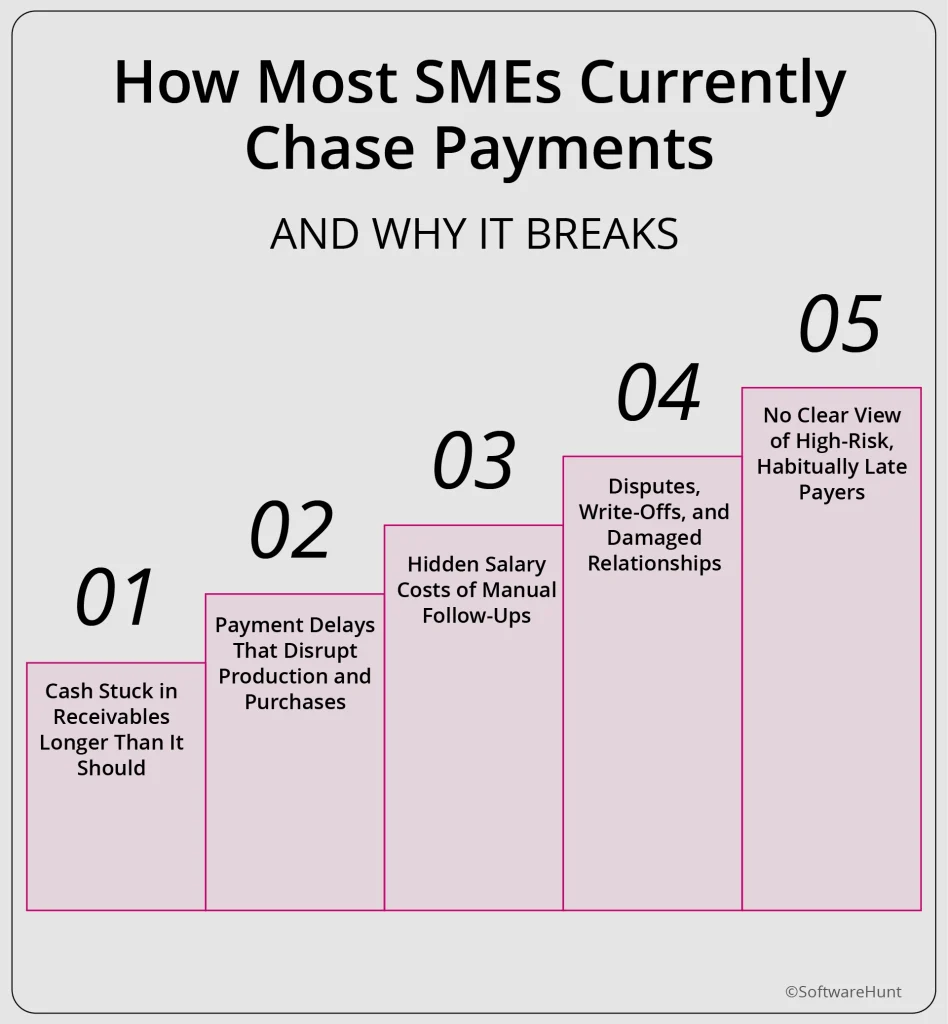
How Most SMEs Currently Chase Payments (And Why It Breaks)
Walk into any manufacturing business between ₹5 crore and ₹50 crore revenue, and you’ll see the same pattern.
The manual follow-up cycle:
Day 1: You deliver the order.
Day 3-5: Finance team sends the invoice. Maybe. If they’re not swamped with month-end closing.
Day 30: Invoice is due. Customer ignores it. Your system doesn’t send automatic reminders because you don’t have one.
Day 35: You call. “We’re processing it. Should be done soon.”
Day 45: You email. “It’s with accounts, waiting for approval.”
Day 60: Customer finally pays. Partially. Says the balance will come next week.
Day 75-90: You get the remaining amount. After four more calls, three emails, and one mildly frustrated WhatsApp message.
This happens every single month. For every customer. For every invoice.
The hidden cost? You or your finance manager spend 14 hours every week chasing late payments.
That’s 700 hours a year. The equivalent of a part-time employee doing nothing but following up on money you’ve already earned.
If your time is worth ₹2,000 per hour and if you’re running a ₹15 crore business, it’s worth more, you’re burning ₹14 lakh annually just on follow-up time.
And that’s before we count the actual money leaking.
Why this system breaks:
You’re reactive, not proactive. You chase after customers are 60 days overdue, not when they’re trending toward delays at 35 days.
You have no visibility. You don’t know which customers consistently pay late until they’ve been late for months. No early warning system.
Relationship strain. Every follow-up call feels like nagging. Your customer feels hassled. You feel like a debt collector instead of a business partner.
No pattern recognition. You can’t spot that Customer B, who used to pay in 30 days, is now stretching to 45, then 60, then 75 days. By the time you notice, they’re a problem account.
Most importantly: You’re treating all customers the same.
Customer A pays in 28 days like clockwork. Customer B pays in 75 days after endless chasing. Both get Net 30 terms.
What’s actually happening? Customer A is subsidizing Customer B’s cash flow with your working capital.
And you’re funding it.
Way #1: Cash Stuck in Receivables Longer Than It Should
Let’s talk about what’s really happening to your money.
You close a deal. You deliver. You’ve “made the sale.” Revenue gets recorded on your books. Your P&L looks good.
But the cash? It sits in your customer’s bank account for 60, 75, 90 days while you need it now.
This is the Cash Conversion Cycle problem.
Here’s the formula that explains why you’re always tight on cash despite growing revenue:
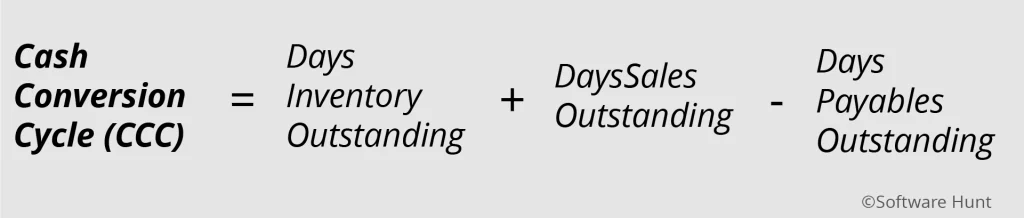
How long your money is tied up between when you pay for materials and when customers finally pay you.
Let’s calculate yours.
Your current state (typical Tier 2 manufacturer):
You hold inventory for 60 days before it sells. Raw materials sit in the warehouse. Work-in-progress takes time. Finished goods wait for dispatch.
Customers pay in 75 days on average. Not the 30 or 45 days you agreed on. The actual number when you track it.
You pay suppliers in 30 days. Because they won’t give you more time. And if you delay, they cut you off or demand advance payment.
CCC = 60 + 75 – 30 = 105 days
Your money is locked for 105 days every single cycle.
Healthy benchmark for manufacturing SMEs?
60 to 75 days. Not 105.
That 30-45 day gap? It’s killing you.
Here’s what it costs:
Let’s say you do ₹5 crore in annual sales.
Daily sales = ₹5 crore ÷ 365 = ₹1.37 lakh per day
At 105-day CCC: ₹1.37 lakh × 105 = ₹1.44 crore tied up at any given time
At healthy 75-day CCC: ₹1.37 lakh × 75 = ₹1.03 crore tied up
Excess working capital locked: ₹1.44 crore – ₹1.03 crore = ₹41 lakh
That ₹41 lakh sitting idle could:
- Earn 8-12% annual return if invested conservatively = ₹3.3 to ₹4.9 lakh per year in opportunity cost lost
- Capture 2% early payment discounts from suppliers = ₹10 lakh per year saved on ₹5 crore in purchases
- Fund new machinery, hire skilled workers, expand to new markets
Instead, it’s trapped in receivables.
Your action metric:
Calculate your Days Sales Outstanding right now.

If your total unpaid invoices are ₹30 lakh and you did ₹1.2 crore in sales last quarter (90 days):
DSO = (30 ÷ 120) × 90 = 22.5 days
But if unpaid invoices are ₹75 lakh:
DSO = (75 ÷ 120) × 90 = 56 days
If DSO is above 60 days, you’re losing lakhs annually in locked working capital.
Most manufacturing founders I talk to don’t know their DSO. They know revenue. They know profit margin. But they don’t know how long customers actually take to pay.
That’s the first leak.
Way #2: Payment Delays That Disrupt Production and Purchases
Here’s where it gets worse.
Customer A owes you ₹15 lakh. The invoice is 60 days overdue. You’ve called twice. They keep saying “next week.”
Meanwhile, Supplier B needs ₹10 lakh from you in 7 days for the raw materials you ordered. You need those materials to fulfill three other customer orders worth ₹50 lakh.
But you don’t have the cash. Because Customer A hasn’t paid.
Your options (all bad):
Option 1: Delay your supplier payment
Supplier B gets upset. They’ve extended credit to you before, but this is the third time you’ve been late.
Next time you order, they demand 10% advance payment. Or worse, they deprioritize your order.
Your materials arrive two weeks late instead of on time.
Your production gets delayed two weeks.
Five customer orders are affected. Three customers wait (unhappy). Two customers cancel—₹15 lakh in revenue gone.
The three who waited? You pay ₹5 lakh in penalty clauses for late delivery.
Total immediate impact: ₹20 lakh.
But it doesn’t stop there.
That supplier now treats you as a credit risk. No more early payment discounts. You used to get 2% off for paying within 10 days—that was ₹6,000 per month on ₹3 lakh in purchases, or ₹72,000 per year.
Gone.
Lead times increase permanently because you’re not their priority customer anymore.
Option 2: Take an emergency loan
You borrow ₹10 lakh for 45 days to pay the supplier.
Interest rate? If you’re lucky, 18% annual. Some SMEs in 2024 were paying up to 26%.
Let’s use 18%.
Cost = ₹10 lakh × 0.18 × (45 ÷ 365) = ₹22,192
If this happens six times a year—and for many businesses it does—you’re paying ₹1.33 lakh in interest just to cover the gap created by late customer payments.
Option 3: Stop production
You don’t have cash. You don’t want more debt. You halt production for two weeks until Customer A pays.
Your fixed costs don’t stop. Rent, salaries, utilities continue. That’s ₹3 lakh per week burning with zero output.
₹6 lakh gone in two weeks.
Customer orders delayed. Some cancel. Reputation takes a hit. Future sales at risk.
This is the domino effect of payment delays:
Customer doesn’t pay you → You can’t pay supplier → Supplier delays or cuts you off → Production stalls → You can’t deliver to other customers → Customer satisfaction drops → Lost sales → Damaged relationships
One delayed payment triggers five failures downstream.
Why manufacturing specifically hurts:
The cycle is longer. Much longer.
In India, a typical manufacturing order goes like this:
60 days: Production time (raw material to finished goods)
30 days: Transit and logistics
90 days: Letter of Credit or payment processing
Total: 180 days from start to cash in hand
And often, payments come beyond 180 days.
You’re operating on: Pay suppliers upfront → produce for 60 days → ship for 30 days → wait 90+ days for payment.
Your entire cash flow is negative for six to nine months on every order.
If even one customer delays by an additional 30-60 days, your working capital gets strangled.
Count this for yourself:
In the last six months, how many times did you:
- Delay a supplier payment because you didn’t have cash?
- Take an emergency loan or use your overdraft facility?
- Stop or delay production because materials weren’t available, even though you had orders?
If the answer is more than three times, payment delays are costing you ₹5 to ₹10 lakh annually in this category alone.
Way #3: Hidden Salary Costs of Manual Follow-Ups
Let’s quantify the time waste.
Your finance manager or you, if you’re handling collections, spends significant time every week chasing late payments.
Global SME data shows the average is 14 hours per week.
Let’s break down what those hours look like.
Per invoice (60-day collection cycle):
You send eight follow-up reminders over two months. One every 7-10 days after the due date.
Each reminder takes 10 minutes. Call the customer. Log the conversation. Send a follow-up email. Update the tracker.
80 minutes per invoice.
If you have 20 invoices per month, that’s:
20 × 80 minutes = 1,600 minutes = 26.7 hours per month
Annually: 320 hours
What does that cost?
Scenario A: Your finance manager does it
Salary: ₹60,000 per month
Hourly rate: ₹60,000 ÷ 160 working hours = ₹375 per hour
Monthly cost: 26.7 hours × ₹375 = ₹10,012
Annual cost: ₹1.2 lakh
Scenario B: You do it yourself
Your opportunity cost as a founder: ₹2,000 per hour (conservative—it’s likely higher)
Monthly cost: 26.7 hours × ₹2,000 = ₹53,400
Annual cost: ₹6.4 lakh
That’s just the time.
Now add the errors.
Manual invoice processing has a 1.6% error rate per invoice.
Every error costs ₹4,400 to resolve – calls, corrections, reconciliations, rework.
For 240 invoices per year:
240 × 0.016 = 3.84 errors
3.84 × ₹4,400 = ₹16,896 annual error cost
Add it up:
- ₹6.4 lakh: Your time chasing payments
- ₹17,000: Invoice errors and corrections
- ₹6 lakh: Missed early payment discounts
Total: ₹12.57 lakh per year
Just in this category.
Way #4: Disputes, Write-Offs, and Damaged Relationships
The longer an invoice sits unpaid, three things happen.
Disputes emerge. Partial write-offs become necessary. Relationships sour.
Let me show you the math on bad debt.
Accounts Receivable Aging Analysis
This is how you assess collection health. Group your unpaid invoices by how long they’ve been sitting.
Here’s what the risk looks like:
0-30 days old: 1% chance it becomes bad debt. Recent invoice. Customer likely will pay.
31-60 days old: 5% risk. Overdue, but still recoverable with reminders.
61-90 days old: 10% risk. Definitely a problem. Needs escalation.
90-120 days old: 25% risk. High chance you’re not getting full payment.
120+ days old: 50-75% risk. You’re likely writing off half or more.
Let’s figure out how much you owe.
Right now, you have ₹93 lakh in total receivables, spread out like this:
- ₹40 lakh in the 0–30 days bucket (1% risk) means a loss of ₹40,000.
- ₹25 lakh in 31 to 60 days (5% risk) means a loss of ₹1.25 lakh.
- ₹15 lakh in 61 to 90 days (10% risk) means you should expect to lose ₹1.5 lakh.
- ₹8 lakh in 90–120 days (25% risk) = ₹2 lakh loss expected.
- ₹5 lakh in 120 days or more (50% risk) means a loss of ₹2.5 lakh.
The total amount of bad debt expected each year is: 7.25 lakh rupees.
That puts 7.8% of your accounts receivable at risk.
Healthy benchmark?
70-80% of invoices should be paid within 30 days. Less than 10-15% should age past 60 days.
If 30% of your receivables are aging past 60 days, like in the example above, you have a red flag.
You’re not just waiting for money. You’re losing money.
The relationship damage math:
Customer B has been good for three years. ₹50 lakh in annual orders. Consistent. Reliable.
Then payment starts slipping. From 30 days to 75 days.
You escalate. Daily calls. Stern emails. Threatened to hold future orders.
They feel hassled. Next year, they switch to your competitor.
Lost lifetime value:
3 years remaining in expected relationship × ₹50 lakh per year = ₹1.5 crore in future revenue
At 15% net margin, that’s ₹22.5 lakh in profit you just lost.
Because you didn’t have a better way to manage collections than nagging.
Early warning signals you should track:
These five behaviors predict bad debt before it happens:
- Slow payments trending: Customer used to pay in 30 days, now it’s 45, then 60, then 75. They’re in trouble.
- Payment dilution: Partial payments instead of full amounts. “We’ll pay ₹5 lakh now, balance next week.” Red flag.
- Payment method shifts: Switching from fast digital payments to slow checks or bank transfers. They’re buying time.
- Dispute frequency increases: Suddenly every invoice has a “problem.” Delaying tactic.
- Communication deteriorates: Harder to reach. Excuses. Avoidance.
If you’re not tracking these patterns, you’re reactive. You find out someone’s a bad payer after they owe you ₹20 lakh, not when they owe you ₹2 lakh.
Still trying to “figure it out” on your own?
Our team is happy to connect with you, understand your personal pain points, operational leaks and growth challenges and go beyond platform listings/information to help find the right solution for you at no cost to you.
Email an advisor for a quick fit-check write to us at connect@softwarehunt.com
Way #5: No Clear View of High-Risk, Habitually Late Payers
Here’s a question: Do you give different payment terms to different customers based on how they actually pay?
Most don’t.
Everyone gets Net 30 or Net 45. Good payers and bad payers alike.
What’s happening:
Customer A pays in 28 days. Every time. Like clockwork. No follow-up needed.
Customer B pays in 75 days. Always. After four reminders and three phone calls.
Both get the same terms. Both get the same credit limit.
The problem: You’re using your working capital to subsidize Customer B’s cash flow.
Here’s what it costs you.
Customer B scenario:
They order ₹10 lakh worth of goods every month.
You give them Net 30 terms. They pay in 75 days.
They’re using your ₹10 lakh for 45 extra days, interest-free.
Your cost:
If you needed that ₹10 lakh, you’d borrow at 15% annual interest to cover operations.
Cost of those 45 days: ₹10 lakh × 0.15 × (45 ÷ 365) = ₹18,493 per month
Annual cost: ₹2.22 lakh
Just for one customer.
If you have five customers like this, that’s ₹11 lakh per year in invisible financing you’re providing them.
What you could do instead:
Offer Customer A a 2% discount for paying in 15 days instead of 30.
That’s a ₹20,000 discount on a ₹10 lakh monthly invoice.
They pay in 15 days. You have cash 60 days earlier than Customer B would give it to you.
You save ₹2.22 lakh – ₹20,000 = ₹2.02 lakh net on that one customer relationship.
Or change Customer B’s terms.
Require 50% advance payment. Balance within 30 days of delivery.
You get ₹5 lakh upfront every order. Your working capital burden drops by half immediately.
If they balk? They’re the customer who was costing you ₹2.22 lakh per year anyway. Better to lose them now than after they owe you ₹20 lakh in bad debt.
Why most SMEs don’t do this:
Lack of visibility. You don’t have a system tracking payment behavior over time. No alerts when a customer starts trending toward delays.
Fear of losing the customer. “If I tighten terms, they’ll go to a competitor.”
Reality check: Customers respect clarity and consistency. High-risk customers who refuse fair terms are exactly the ones who’ll eventually default.
Better to identify them early.
What segmentation should look like:
Pull payment data for the last 6-12 months for every customer.
Calculate average DSO per customer. Not overall—per customer.
Customer A: Average 28-day DSO → Low risk
Give them Net 45 terms. Maybe offer loyalty benefits. They’re subsidizing your operations in a good way.
Customer B: Average 55-day DSO → Medium risk
Stick to Net 30. Monitor closely. First sign of slipping to 60+ days, you intervene immediately.
Customer C: Average 75-day DSO → High risk
Terms change. 50% advance. Balance on delivery or within 15 days. Non-negotiable.
If they’re worth ₹10 lakh per month but cost you ₹2+ lakh per year in working capital drag, the math doesn’t work.
Total for Way #5:
If you have five high-risk customers dragging at ₹2 lakh cost each: ₹10 lakh per year
Plus the opportunity cost of not optimizing terms for low-risk customers who’d happily pay faster for a small discount.
A Simple Self-Check: Are Payment Delays Quietly Draining You?
For each question, say YES or NO.
If you answer YES to five or more, you are losing at least ₹8 to ₹15 lakh a year because of payment delays.
Cash Flow Indicators:
☐ Do you often use emergency loans or overdrafts to pay for operations?
☐ Is it stressful every month to pay your employees on time?
☐ Do you put off paying suppliers because you don’t have enough money?
☐ Have you turned down new orders because you couldn’t pay for the raw materials up front?
Collection Process Indicators:
☐ Do you or your team spend 10+ hours per week chasing payments?
☐ Are invoices frequently paid 60+ days after the due date?
☐ Do customers often make partial payments instead of full amounts?
☐ Have payment disputes increased in the last six months?
Visibility Indicators:
☐ Can’t quickly answer: “What’s our current DSO?”
☐ Don’t have an AR aging report (or don’t review it monthly)?
☐ Can’t name your top three slowest-paying customers off the top of your head?
☐ Don’t track individual customer payment behavior over time?
Your score:
0-2 YES: Minor issues. ₹2-3 lakh annual impact. Tighten up a few processes.
3-4 YES: Moderate drain. ₹5-8 lakh annual impact. You need better visibility and collection discipline.
5-7 YES: Significant problem. ₹8-12 lakh annual impact. Payment delays are materially hurting profitability.
8+ YES: Critical. ₹15-20 lakh+ annual impact. This is one of your biggest profit leaks right now.
What a Healthier, Low-Stress Payment Process Should Look Like
Let’s talk about what changes when you fix this.
Not theory. Actual day-to-day operations.
Current state (reactive):
Invoice sent 3-5 days after delivery. Manually.
Customer ignores it.
You call at 30 days. “Processing.”
You call again at 45 days. “Waiting for approval.”
Payment at 75 days after multiple follow-ups.
Repeat next month. Every customer. Every invoice.
Healthy state (proactive):
Invoice sent same day as delivery. Automatically triggered when goods are dispatched.
Customer receives automated reminders:
- Day -7: “Your invoice of ₹10 lakh is due in 7 days”
- Day 0: “Payment due today”
- Day +3: “Payment overdue. Please remit immediately”
- Day +7: Escalation tone. “This is now 7 days overdue. Please settle within 48 hours”
- Day +14: Final notice before collections action
You only intervene manually after Day +14, and only for exceptions.
70% of invoices get paid within 30 days without you lifting a finger.
The 30% that need attention? You know exactly who they are. You can focus energy there instead of chasing everyone.
What makes it work:
System 1: Instant invoicing
Invoice generated automatically when delivery is confirmed in your system. Sent via email with embedded payment link. Customer can pay in two clicks.
System 2: Automated reminder sequences
Set it once. Runs forever. Polite but persistent. Removes the awkwardness of you calling repeatedly.
System 3: AR aging dashboard
Live view of all outstanding invoices grouped by age.
Color-coded: Green (0-30 days), Yellow (31-60 days), Red (60+ days).
Weekly 15-minute review tells you exactly where problems are.
System 4: Customer payment scoring
Tracks average DSO per customer over six months.
Flags customers trending slower.
Automatically suggests term adjustments. “Customer B DSO increased from 45 to 65 days. Recommend changing terms to 50% advance.”
System 5: Escalation protocol
Clear rules.
- Day 1-30: Automated only
- Day 31-45: Account manager calls (relationship-first tone)
- Day 46-60: Stricter follow-up (email from finance head or founder)
- Day 61+: Hold future orders. Legal notice if needed.
Everyone knows the process. No surprises.
ROI of moving to a healthy state:
Your current annual loss (from the five ways):
- Working capital lockup: ₹4 lakh
- Production disruptions: ₹6 lakh
- Manual follow-up time: ₹13.5 lakh
- Bad debt and disputes: ₹16.75 lakh
- High-risk customer drag: ₹10 lakh
Total bleeding: ₹50.25 lakh per year
After implementing a healthier process (Year 1 impact):
DSO reduces from 75 to 50 days. Not 45 immediately, but improving steadily.
Working capital freed: ₹20 lakh. You reduce overdraft usage, earn modest returns.
Manual follow-up time cut by 60%: Save ₹8 lakh.
Bad debt drops to 1.5% of receivables: Save ₹8 lakh.
Production disruptions cut in half: Save ₹3 lakh.
Total Year 1 savings: ₹39 lakh
That’s a 78% reduction in losses.
Want to Talk Through Your Current Collections Process?
Here’s what we’ve learned talking to hundreds of manufacturing founders over the last five years.
Most have never calculated their DSO. They don’t know how much working capital is locked in receivables. They’ve never mapped which customers are high-risk versus low-risk. They’re aware cash is tight, but they don’t know exactly where the ₹10-15 lakh is leaking every year.
And because they can’t see it, they can’t fix it.
We’re SoftwareHunt. We work with manufacturing owners running on Tally, Excel, and lean teams to understand your operational leaks and growth challenges. We go beyond platform listings to help you find the right solution at no cost to you.
We’ll help you translate symptoms into clear financial insight and show you where to focus first – at no cost to you.
To email an advisor for a quick fit-check write to us at connect@softwarehunt.com