TL;DR
- 60% of the records of small and medium-sized businesses’ inventory are wrong. Phantom stockouts, dead stock, and shrinkage all cause inventory to leak lakhs every year.
- 8 Hidden Profit Leaks: Too much carrying costs, dead stock burden, shrinkage, emergency expediting, lost sales, wasted labor, variance writedowns, and failure to forecast.
- The Way Ahead (16 Weeks, 3 Phases): Phase 1: Find out how accurate you are right now. Phase 2: Build discipline by standardizing codes, fixing receiving, and counting cycles every week. Phase 3: Keep going (monthly reconciliation, audits to find problems before they happen, and a forecasting loop).
Your warehouse supervisor just told you the material is “somewhere” for the third time this week.
Your customer is waiting. Your sales team promised delivery based on what Tally says is in stock. But Tally lies.
You have two options: Delay the customer or emergency-order the material at 3-5x the normal cost.
This happens every month. Sometimes twice a week.
Here’s what you don’t realize: That recurring “somewhere” is costing you ₹20-40 lakhs every year.
Not all at once. In pieces so small you never see it as one problem.
₹2 lakhs here in emergency orders. ₹1.5 lakhs there in carrying costs. ₹80,000 over there in labor wasted searching. By December, you’ve bled ₹20+ lakhs in profit while thinking everything was “fine.”
This blog quantifies those invisible leaks and shows you exactly what to do about it.
Does Your Business Have This Problem? (Quick Check)
- Warehouse can’t locate materials within 5 minutes
- System shows inventory that doesn’t actually exist
- Month-end reconciliation takes 2+ days
- You place emergency orders monthly
- One person knows where everything is
- You have ₹5+ lakhs in inventory nobody uses
- Production delays because materials are “missing”
If you answered YES to 3+, this blog is for you. Keep reading.
Three Quick Wins You Can Do This Week
You don’t need software yet. You need data.
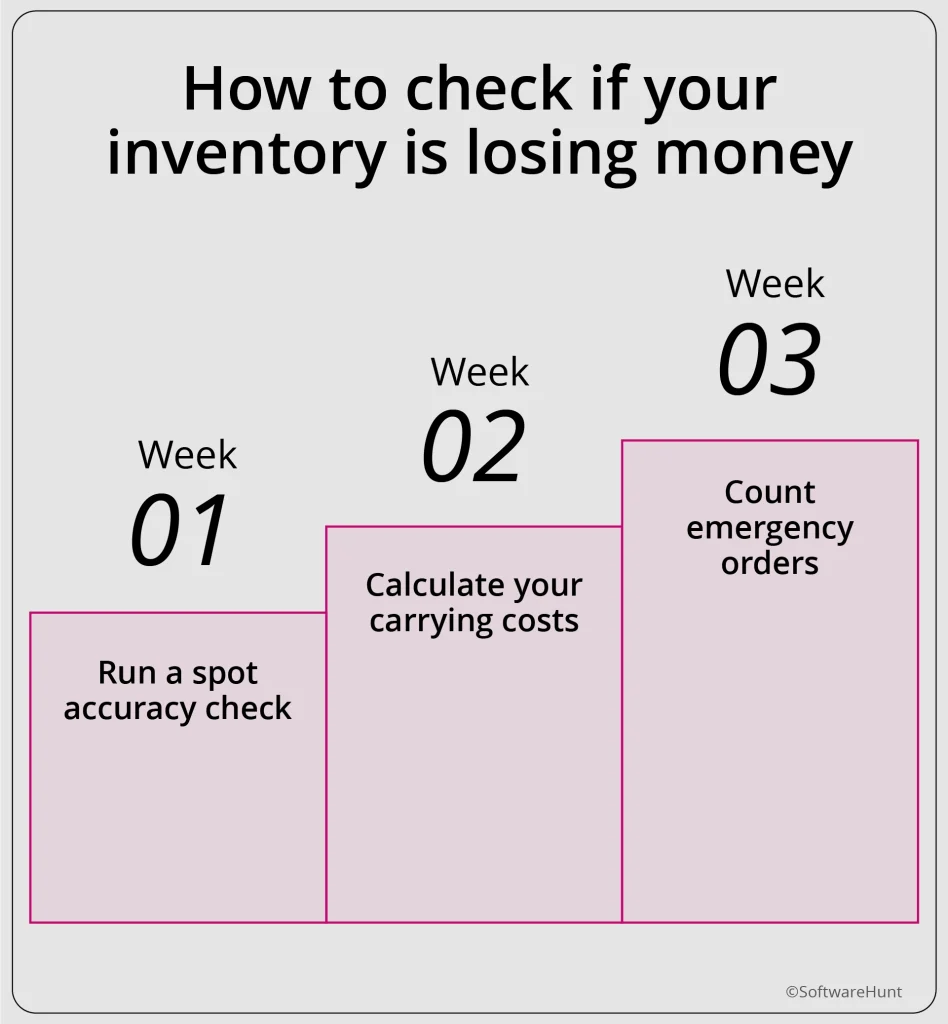
Week 1: Run a spot accuracy check
Pick 20 random SKUs. Count them physically. Compare to your system.
The discrepancy percentage? That’s roughly your current accuracy.
If it’s >10% off, you have a real problem costing serious money.
Week 2: Calculate your carrying costs
Take your average inventory value. Multiply by 25% (typical carrying cost for manufacturing).
That number is what you pay annually just to hold inventory sitting around, warehouse rent, your money tied up, insurance, things going missing.
If that’s >₹5 lakhs per year, keep reading.
Week 3: Count emergency orders
How many times last month did you need material “right now” because the system was wrong or you ran out unexpectedly?
Multiply that number by ₹50,000 (typical emergency sourcing cost). That’s one month’s damage from inventory problems alone.
Do these three things. You’ll know exactly what you’re dealing with.
The Real Cost (What The Math Shows)
Let’s be concrete. Let’s say your average inventory is ₹50 lakhs and your system is 60% accurate (typical for Excel-based tracking).
Here’s what that costs you annually:
Emergency orders (when system fails and you need material fast): ₹4 lakhs
Dead stock (inventory nobody uses, sitting and rotting): ₹2.5 lakhs in carrying costs alone
Shrinkage (material that goes missing, gets damaged, nobody documents): ₹5 lakhs
Lost sales (customer couldn’t wait, went to competitor): ₹10 lakhs
Labor waste (people searching warehouses, reconciling, chasing suppliers): ₹8 lakhs
Total annual loss: ₹29.5 lakhs
That’s 59% of your inventory value wasted.
For a ₹10 crore revenue business, that’s approximately 3% of your annual profit leaking silently.
Not theoretical. Real.
Where does it come from exactly?
The Ghost Stock Problem
Your system says you have 500 units of raw material A in stock.
Your warehouse actually has 350 units.
The missing 150? Some got damaged during receipt and weren’t recorded. Some went to a job and weren’t logged properly. Some expired (you’re not tracking batch dates). Some just walked off.
Your sales team trusts the system. They promise a customer delivery based on 500 units.
Three days into production, warehouse discovers the shortage.
Now you’re in emergency mode. You either delay the customer (lose trust, possible order cancellation) or emergency-order material at 3-5x normal cost.
That one gap just cost you ₹50,000 to ₹1,50,000.
This happens weekly in most Tier 2/3 manufacturing businesses. Nobody connects the dots to see it as one cumulative problem.
The Dead Stock Sitting Unnoticed
Somewhere in your warehouse is material from 18 months ago.
Maybe it was bought for a project that was cancelled. Maybe the customer changed specs. Maybe you just don’t remember why it’s there.
It’s ₹8-12 lakhs sitting unmoving.
That capital could be driving growth. Instead it’s locked in something you’ll never use.
But the real cost is this: You’re paying to hold it.
Warehouse rent, insurance, your money tied up, inventory costs you about 20-30% of its value annually. So that ₹10 lakh dead stock costs you ₹2-3 lakhs per year just to keep it there.
In most businesses, this only gets discovered during the annual physical count. By then, you’ve already burned months of carrying costs. And in many cases, dead stock isn’t even counted annually. It just sits there, slowly eroding profit.
The Month-End Reconciliation Nightmare
It’s the 25th. Finance is waiting for inventory reconciliation before finalizing the month.
Your operations team spends the next 3-4 days:
- Matching purchase orders to goods receipt notes to invoices
- Searching the warehouse for materials that “should be” somewhere but aren’t labeled
- Recounting sections where discrepancies emerged
- Calling suppliers to verify delivery status because records don’t match
All manual. All repetitive. Zero value created.
This is 3-4 days × 2 people × ₹1,500/day salary = ₹9,000-12,000 gone every month.
Multiply by 12 months: ₹1.08-1.44 lakhs annually on manual reconciliation that exists only because your system doesn’t work.
Add the time spent on emergency material searches (warehouse teams waste 30% of their labor just searching) and chasing vendors for status updates, and that number climbs to ₹8+ lakhs per year in pure wasted labor.
The Warning Signs (Check Yourself)
You might not realize you have a problem yet. But here are the signals.
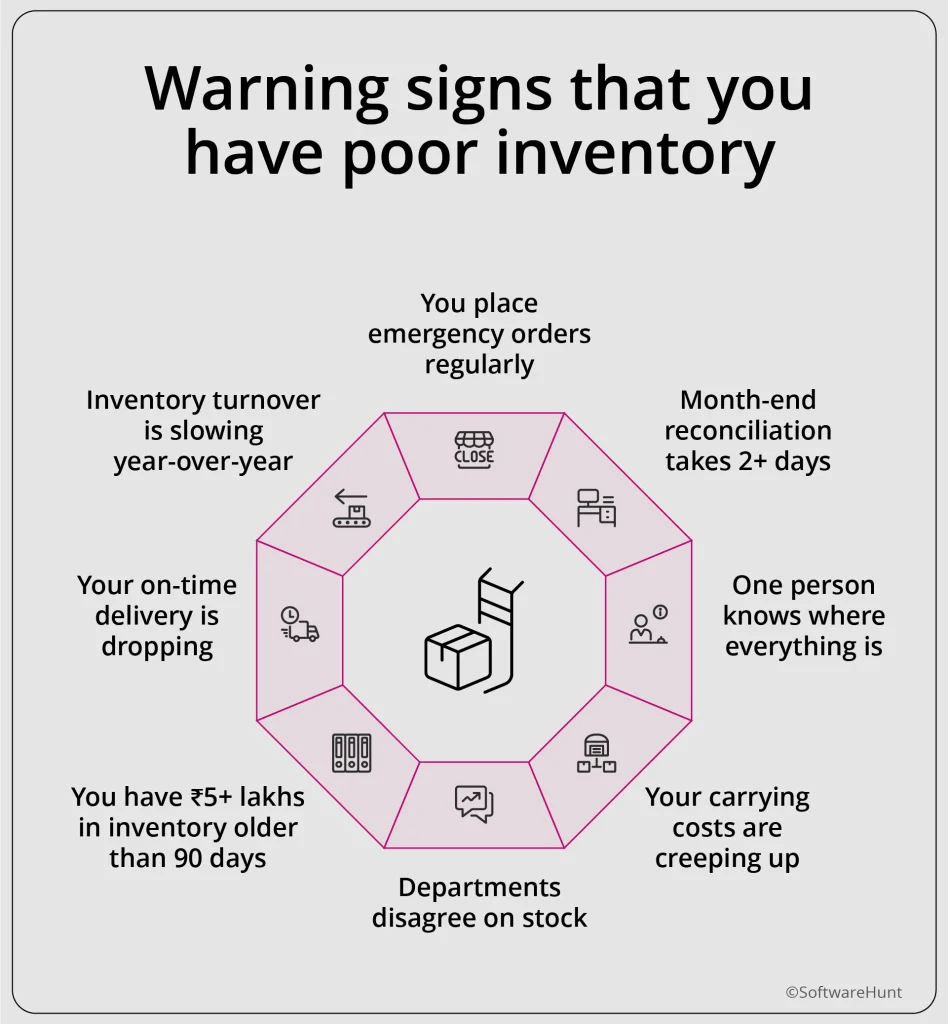
You place emergency orders regularly. More than once or twice a month? That’s a red flag. Your forecasting isn’t working.
Month-end reconciliation takes 2+ days. For a ₹50 lakh inventory, proper reconciliation should take 1-2 hours. Anything more means your data isn’t clean.
One person knows where everything is. “Only Rajesh knows the inventory.” When Rajesh goes on leave, production stalls. That’s a liability, not a strength.
Your carrying costs are creeping up. Track this quarterly. Healthy: 20-22%. If you’re at 28%+, you have serious overstocking or dead stock happening.
Departments disagree on stock. Sales says ₹45 lakhs. Finance says Tally shows ₹50 lakhs. Operations says realistically ₹42 lakhs is available. Everyone’s making decisions based on different numbers. That’s a broken system.
You have ₹5+ lakhs in inventory older than 90 days. That’s dead stock. It should be <10% of total inventory. If it’s 15-20%, nobody’s managing slow-movers actively.
Your on-time delivery is dropping. Production delays because materials are “missing” even though you think you have them. That’s phantom stockouts.
Inventory turnover is slowing year-over-year. You should be turning inventory 4-6 times per year. If it’s slowing to 2-3 times, you’re holding more inventory longer. Capital is getting trapped.
The more of these you recognize, the bigger your problem.
Still trying to “figure it out” on your own?
Our team is happy to connect with you, understand your personal pain points, operational leaks and growth challenges and go beyond platform listings/information to help find the right solution for you at no cost to you.
Email an advisor for a quick fit-check, write to us at connect@softwarehunt.com
The Path Forward (16 Weeks)
Here’s the good news: This is fixable. You don’t need expensive software. You need discipline.
Weeks 1-2: Assess & Diagnose
Do a spot accuracy check:
Pick 20 random SKUs. Count them physically. Compare to your system. The discrepancy percentage is your current accuracy baseline.
Calculate your carrying costs:
Take average inventory × 25%. That’s your annual carrying cost. It should be <₹15 lakhs for ₹50 lakh inventory. If it’s >₹15 lakhs, you’re overstocking.
Count emergency orders:
How many times did you scramble for material last month? Multiply by ₹50,000. That’s your emergency cost.
Quantify the damage:
Do the math from earlier. Calculate your total annual loss across the five categories. Write that number down. You’ll use it later.
Weeks 3-8: Build Discipline
Standardize item codes:
Every SKU gets a unique identifier. Define units clearly (kg, units, boxes, not “misc materials”).
Fix the receiving process:
Verify quantity received vs. purchase order. Document quality issues immediately. Record exact bin location in system. Match to invoice only after verification. This stops discrepancies at the source.
Track every movement:
When material moves (receipt, issue, transfer), log it. Real-time if possible. Same-day minimum. Bin locations update as stock moves. Nobody searches later.
Set up cycle counts:
Don’t do annual physical counts. Do weekly cycle counts instead.
- High-value items: Weekly count
- Medium-value items: Bi-weekly count
- Low-value items: Monthly count
Reconcile discrepancies immediately. Find root cause. Fix it. This catches problems early, not end-of-year.
Assign one inventory owner:
Clear accountability. Not a committee. Someone owns the accuracy. Clear roles: Who receives? Who issues? Who approves? One person can’t do both receiving and approving.
Weeks 9+: Sustain
Monthly reconciliation:
Match POs to receipts to invoices. Variance analysis. Obsolescence review. Every discrepancy gets a root cause analysis, not just an adjustment.
Weekly stock reports:
What moved, what aged, what’s at risk. ABC analysis (which items matter most). Carrying cost tracking (is it staying at 20-22%?).
Review consumption vs. forecast:
Actual usage vs. what you predicted. Adjust reorder points monthly. Factor in seasonality. Communicate changes to procurement.
Surprise audits:
Random full count in one warehouse zone weekly. Keeps everyone honest.
What Healthy Inventory Looks Like
You don’t need perfection. You need health.
97% accuracy. System count matches physical count within 2%. (Note: Every 1% improvement in accuracy unlocks ₹50-75 lakhs in working capital for a business your size.)
Real-time visibility. You answer “How much material X do we have?” in 5 minutes from a system, not by asking the warehouse.
<5% stockout incidents per month. Some external delays are unavoidable. System-driven stockouts should be rare. When you hit this, on-time delivery jumps to 95%+ and revenue increases 4-8%.
Dead stock <10% of inventory value. On ₹50 lakh inventory, that’s max ₹5 lakhs sitting unmoving.
Reconciliation <2 hours per month. If matching POs to receipts to invoices takes less than 2 hours, your data is clean.
Material located in <2 minutes. When you need something, you find it fast. If warehouse team spends 15-30 minutes searching, you have a bin-location system problem.
<2% annual shrinkage. Industry best practice. If you’re at 5-8%, you have receiving discipline issues or audit trail gaps.
Carrying costs at 20-22%. Not 26-30%. The difference (₹50 lakh inventory) is ₹5 lakhs in annual waste.
Forecast accuracy within 5-10%. Your forecast vs. actual usage should be tight. If you’re off by 20-30% regularly, you’re guessing, not planning.
ABC analysis applied. You know which 20% of SKUs drive 80% of profit. Manage them tightly. Manage low-value items loosely.
What Most Businesses Get Wrong
Don’t do these:
“We’ll do a big inventory count next quarter to fix it” By then, 3 months of new discrepancies have compounded.
“One person will manage all inventory” Single point of failure. When they leave, chaos.
“We’ll update the system once a week with all movements” Data gets stale. Decisions made on old information.
“We don’t need to track dead stock separately” It becomes 20% of inventory while you’re not looking.
“Our Excel spreadsheet is good enough” Not at scale. Over 200 SKUs, it breaks.
Next Step
This roadmap works. But the spot accuracy check in Week 1 is critical. If you’re at >90% accuracy, you don’t have a serious problem yet. If you’re at <85%, you’re losing serious money.
Before you start, let’s diagnose your specific situation.
We’re SoftwareHunt. We work with manufacturing owners running on Tally, Excel, and lean teams to understand your operational leaks and growth challenges. We go beyond platform listings to help you find the right solution at no cost to you.
We’ll help you translate symptoms into clear financial insight and show you where to focus first – at no cost to you.
To email an advisor for a quick fit-check write to us at connect@softwarehunt.com