TL;DR
- Research shows that Indian small and medium-sized businesses (SMEs) that use lean manufacturing can cut down on production waste by 20–30%.
- The Seven Wastes That Are Hurting Your Cash Flow: Overproduction, waiting, moving things, defects, inventory, motion, and processing
- Begin with no cost Following: Daily WhatsApp log from the boss (5 minutes). Weekly summary in Excel (10 minutes). A monthly journal for tallying waste. No need for a fancy MES.
- In the first month, you’ll find ₹1-2 lakh in waste that could have been avoided but you didn’t know about.
- Sort and set 5S for 2 hours (no cost, 15–20% less waste). One gauge checks the quality of the process (₹2,000, 70% fewer defects). Supplier quality agreement (no cost, 40% less waste). Kanban cards (₹50) stop too much production.
The manufacturing industry generates massive amounts of waste, with global figures potentially reaching 9.2 billion tonnes of industrial waste annually.
Every day your workers produce 100 kg of output, they also produce 15-30 kg of waste. You paid for that raw material. You paid for the labor to handle it. You paid for electricity while it was being cut, machined, and then thrown away.
And you didn’t even know how much.
Most SME owners think they know their waste. They’ve heard about the scrap dealer, seen the rework pile, noticed idle time but they’ve never quantified it. They’ve never tracked it. They’ve never realized that the casual Tuesday-morning scrap sale is actually a ₹9.36 lakh/year subscription to inefficiency.
Why Waste Is a Bigger Problem Than SME Owners Think (The 30% Margin Leak)
Let’s stop calling it “waste” and call it what it really is, which is profit you haven’t captured yet.
The real cost: 15-30% of your raw material is gone before it becomes product
Research shows that Indian SMEs in machining, casting, and assembly lose 15-30% of raw material to waste because there’s no system to track where the material goes.
The math that hurts:
If you buy ₹10 lakh of steel per month and waste 20%, that’s ₹2 lakh/month = ₹24 lakh/year.
At a 10% net margin, you need ₹2.4 crore in additional sales to make up for that loss. You could double your sales, or you could stop the waste. One is easier than the other.
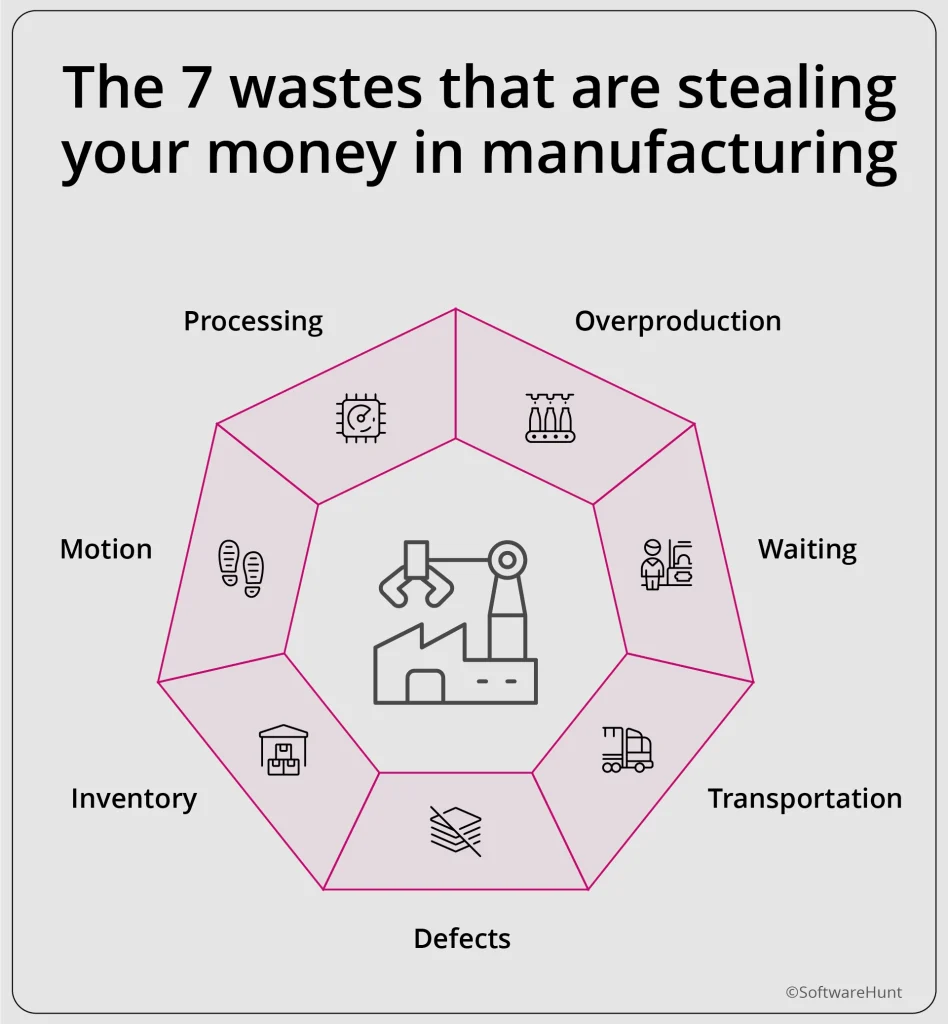
The 7 wastes that are stealing your money
Lean Manufacturing, developed by Toyota, identifies 7 types of waste (called Muda in Japanese). These aren’t theoretical concepts. They’re the exact problems draining cash from your factory floor right now.
Here’s what they look like in your factory:
1. Overproduction: Making 500 pieces when the customer ordered 300 because “we might need them.” The extra 200 become inventory you can’t sell.
2. Waiting: Machines idle 6-8 hours/week because material didn’t arrive, power cut happened, or the supervisor was on a call. That’s 6-8 hours of machine depreciation with zero output.
3. Transportation: Moving material 4 times across the shopfloor because your layout is chaotic. Every move risks damage and adds time.
4. Defects: Producing 200 pieces, then inspecting at the end, finding 30 defective. Now you waste time reworking 30 pieces. In-process checks would have caught the defect after piece #5.
5. Inventory: Raw material stockpiled “just in case” that becomes dead stock. That’s ₹3-5 lakh of your working capital, personally guaranteed, sitting idle.
6. Motion: Workers walking 2-3 km daily fetching tools because 5S wasn’t implemented. That’s paid time moving, not producing.
7. Processing: Using a 5-stage finishing process when 3 stages meet customer specs. You’re adding a cost the customer won’t pay for.
The cash flow cancer: triple loss on every wasted kilogram
Every kg of steel wasted costs you three times:
- Material cost: You paid ₹100/kg for it.
- Labor cost: You paid workers to handle it, cut it, then throw it away.
- Opportunity cost: That worker could have been producing a sellable part instead of handling scrap.
Total cost: ₹250-300 per kg wasted. If you waste 15 kg/day, that’s ₹3,750/day = ₹11.25 lakh/year. That’s your home loan EMI. That’s your kid’s education. That’s not a business expense. That’s a family expense you didn’t sign up for.
The Real-World Signs Your SME Is Bleeding Money
You need a weekly walk through your factory with your phone camera.
Sign 1: Your scrap dealer knows your schedule better than you do
If your scrap dealer shows up every Tuesday without you calling, you have a predictable waste problem. He knows you’ll have 200 kg of metal shavings, 50 liters of used oil, and 30 kg of defective parts. That’s not a vendor relationship. That’s a waste of a subscription.
Sign 2: Your workers have a “rework corner”
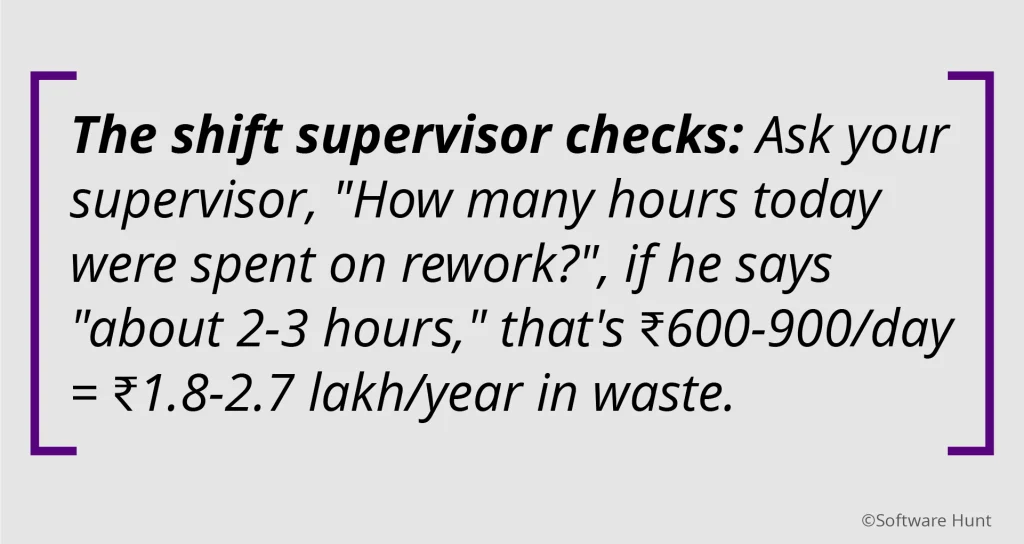
If there’s a designated area where workers “fix” defective parts, you’re not doing quality control. You’re doing quality repair. Manufacturing rework and scrapping can account for 5-30% of total production costs, with human error responsible for up to 80% of quality defects. Research shows that rework costs significantly impact manufacturing economics, one study found that 10% scrap and 20% rework requiring additional 20% wages can add ₹113 per unit to manufacturing costs.
Sign 3: Your power bill spikes during “idle” time
Check your electricity bill. If machines are drawing 40% power when they’re not producing (heating, cooling, standby), you’re paying for waste. One Pune unit discovered 12% of their ₹1.2 lakh monthly power bill came from idle machines waiting for material. That’s ₹1.728 lakh/year in waste.
The idle time audit: For one week, have your supervisor log “machine running but not producing” hours. Multiply by your electricity rate. You’ll find ₹15,000-25,000/month in waste.
Why Waste Happens (The Root Causes SME Owners Ignore)
You know there’s waste. Your workers know there’s waste. So why does it continue?
The “Chalta Hai” culture
Many SME workers don’t report waste because ‘that’s how it’s always been done’—one defective part per batch feels ‘normal,’ 5% material loss seems ‘acceptable.’ This informal acceptance of waste becomes institutionalized inefficiency. Research shows that worker engagement in waste tracking can uncover ₹1-2 lakh in preventable waste in the first month.
No in-process quality checks
You’re inspecting only at the end of the line. By then, you’ve already produced 200 defective pieces. Catching defects at machine level reduces rework by 70%.
The one-gauge rule: Assign one operator per machine to check one critical dimension every 10 pieces. If it fails, stop the machine. Don’t wait for the end-of-line inspector. Cost: One digital gauge (₹2,000). Waste reduction: 70% fewer defects.
Poor 5S implementation
Tools aren’t at the workstation. Workers walk 10 minutes to fetch them, that’s motion waste. Materials aren’t labelled, so wrong batches get mixed, that’s defect waste. 5S isn’t a fancy poster. It’s a daily ritual that cuts waste by 15-20%.
The 2-hour 5S: Don’t do a full 5S audit. Just do Sort and Set:
- Sort: Remove everything from the workstation that isn’t used daily. Put it in a red tag area.
- Set: Arrange tools in order of use. Label everything.
Cost: Zero. Time: 2 hours per workstation. Waste reduction: 5S implementation audit scores improved from 37.6% to 90.4% in manufacturing studies, it also reduces motion waste, transportation waste, and search time significantly.
Supplier quality variations
Your supplier sends steel that’s 5% out of spec. You accept it because “we don’t have time to return.” Now you waste 2 hours adjusting machine settings and produce 10% more scrap. The supplier’s problem becomes your waste.
The Silent Cost of Waste (What Owners Rarely Calculate)
You know waste costs money. But you probably don’t know it costs you three times.
The triple loss formula on every wasted kilogram
Every kg of steel wasted costs you three times:
- Material cost: You paid ₹100/kg for it.
- Labor cost: You paid workers to handle it, cut it, then throw it away.
- Opportunity cost: That worker could have been producing a sellable part instead of handling scrap.
Total cost: ₹250-300 per kg wasted. If you waste 15 kg/day, that’s ₹3,750/day = ₹11.25 lakh/year. That’s your home loan EMI. That’s your kid’s education. That’s not a business expense. That’s a family expense you didn’t sign up for.
The bank manager’s perspective on your waste
Banks and lenders monitor your capacity utilization ratio as a key indicator of operational efficiency. Research shows that Indian SME manufacturers typically operate at 70-72% capacity utilization, with unutilized capacity of 25-28% representing immediate profit opportunities.
The trust metric: Capacity utilization > 80% = Bank manager smiles. Below 70% = He stops returning your calls. Waste is the silent reason your loan renewal gets delayed.
Still unsure what’s actually going wrong?
To email an advisor for a quick fit-check write to us at connect@softwarehunt.com
The First Rule: You Can’t Reduce What You Don’t Measure
Most SME owners think they know their waste numbers because they see the scrap pile growing and hear complaints about rework. But awareness and measurement are different things.
When one Pune machining unit tracked waste for four weeks, the pattern was clear: Monday averaged 8 kg scrap from weekend fatigue, Wednesday spiked to 15 kg from one supplier’s out-of-spec material, and Friday dropped to 6 kg during rushed orders when quality checks got skipped. Before tracking, the owner estimated 10 kg daily waste across the week. The data showed 60% came from a single supplier on Wednesdays.
He called the supplier, showed the numbers, and negotiated a quality agreement. Waste dropped 60% in two weeks.
Tracking shows where the waste happens. Reduction shows how to stop it. You need both because tracking without action becomes documentation, and action without tracking becomes guesswork. Manufacturing research confirms that accurate waste measurement enables targeted interventions that deliver 15-30% reduction within the first quarter.
Track for four weeks before spending money on tools. You’ll find problems you didn’t know existed.
How to Track Waste in an SME
You need discipline. Discipline is free.
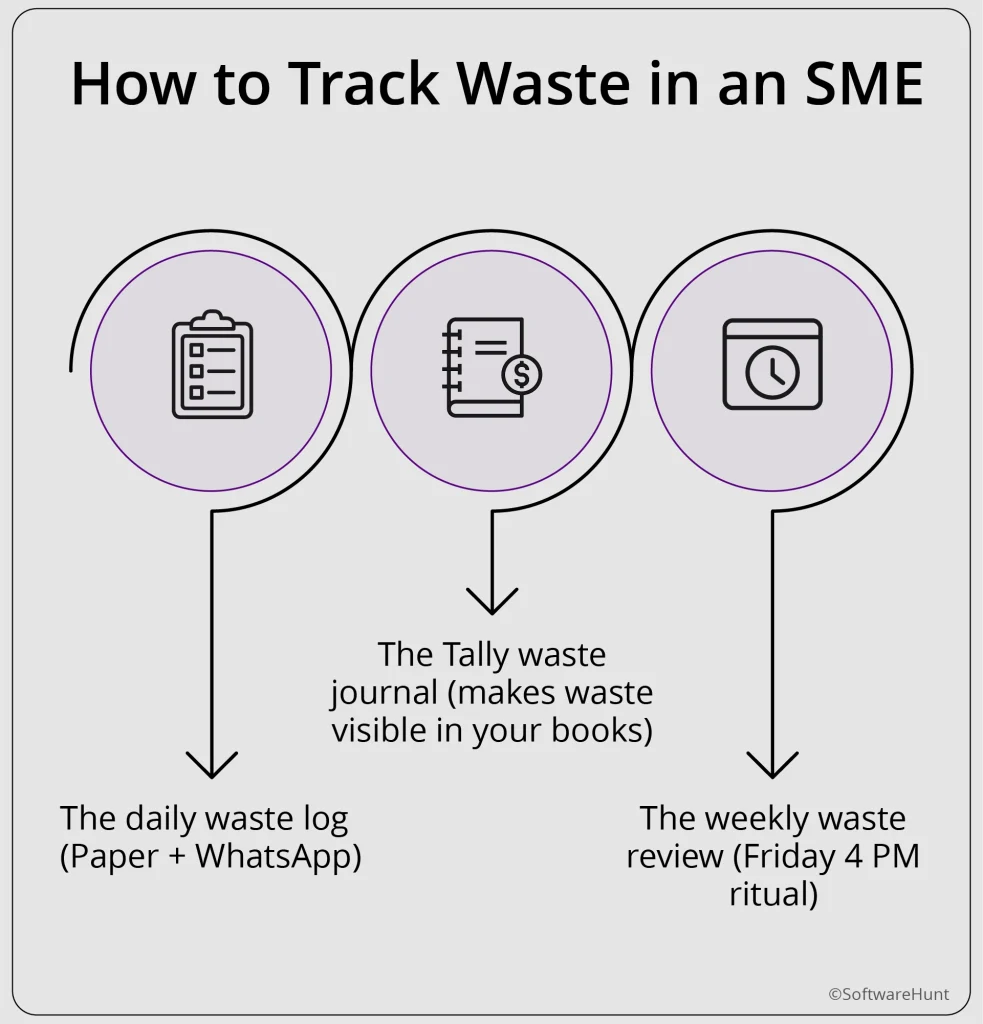
The daily waste log (Paper + WhatsApp)
Every shift, supervisor logs:
- Material wasted (kg)
- Time wasted (hours)
- Defects produced (count)
- Reason (supplier, machine, operator error)
Takes 5 minutes. Use a simple WhatsApp group “Daily Waste” with a template. At the end of the week, the ops head totals it,that’s your baseline.
The Tally waste journal (makes waste visible in your books)
Create a “Waste” stock item category in Tally. Every time material is scrapped, create a stock journal: RM → Waste. Now you can run reports: “Waste value this month = ₹1.2 lakh.” That’s your visibility.
How to set up: In Tally, create a stock item “Waste-Steel” under group “Waste.” Every week, create a journal: Debit Waste-Steel, Credit Raw Material-Steel. Value = quantity × purchase rate. At month-end, run a stock summary. You’ll see waste value in black and white.
The weekly waste review (Friday 4 PM ritual)
Ops head + supervisor + purchase manager review:
- Top 3 waste sources this week
- One action to reduce each
- Who is responsible
Time: 30 minutes. Impact: Reduces waste by 10-15% in the first month because people know they’re being watched.
The 3 metrics every SME should calculate weekly
Once you have daily waste logs, calculate these three numbers every Friday using a simple calculator.
Scrap Rate = (Total scrap weight / Total raw material used) × 100
If you used 500 kg steel and scrapped 18 kg, your scrap rate is 3.6%. Industry benchmarks suggest staying below 5% for machining operations and below 3% for assembly work.
Rework Rate = (Reworked units / Total units produced) × 100
When you produce 400 units and rework 12 of them, your rework rate is 3%. Most efficient manufacturers maintain this below 2%.
First Pass Yield = (Good units first time / Total units produced) × 100
If 388 out of 400 units come out right the first time, your yield is 97%. Target 95% or higher, which top-performing plants consistently achieve.
These three numbers tell you where money leaks. Scrap rate reveals material waste, rework rate shows time waste, and first pass yield indicates process capability. When any metric crosses its target, investigate that day instead of waiting for month-end reports. The calculation takes five minutes with your logs and a calculator.
Benefits of Effective Waste Tracking (Beyond Just Cost Savings)
Margin improvement: 5-8% straight to bottom line
If you waste ₹15 lakh/year and reduce it by 50%, that’s ₹7.5 lakh straight to profit. No new customers needed. No new machines needed. Just better discipline.
The math: If your net margin is 8% and you save ₹7.5 lakh in waste, that’s equivalent to adding ₹94 lakh in revenue. Which is easier? Saving waste or finding ₹94 lakh in new sales?
Bank manager trust: Better capacity utilization ratio
When you show the bank manager that your capacity utilization improved from 65% to 80% because waste was reduced, he sees a well-managed unit. Your loan renewal happens smoothly. Your interest rate doesn’t increase.
The ratio that matters: Capacity utilization = (Actual output / Maximum possible output) × 100. Waste reduces actual output. Reducing waste increases the ratio without buying new machines.
Worker engagement: They see waste, they fix it
When workers start tracking waste, they start noticing it. When they notice it, they start fixing it. One operator in a Pune unit started stacking offcuts neatly instead of tossing them. He found he could reuse 30% of them in smaller jobs. That saved ₹1.2 lakh/year. He got a ₹10,000 bonus. Everyone won.
Customer trust: On-time delivery improves
When you reduce defects and rework, you ship on time. When you ship on time, customers trust you. When customers trust you, they give you bigger orders. Waste reduction becomes revenue growth.
Beyond Cost Savings: Why Waste Tracking Is Now a Compliance Requirement
Waste tracking for manufacturing SMEs stopped being optional around 2019. What used to help optimize costs is now a regulatory and commercial requirement, one that directly determines contract wins, bank approvals, and operational survival.
CPCB Registration Rules for Hazardous Waste
Manufacturing units that generate more than 1 ton of hazardous waste annually are required to register with their State Pollution Control Board under the Hazardous and Other Wastes (Management and Transboundary Movement) Rules, 2016. This includes metal shavings contaminated with cutting oil, chemical residues, used machinery, e-waste, and batteries.
You must conduct yearly waste audits, maintain records of waste generation volume, storage location, and disposal methods through authorized recyclers. Non-compliance carries serious consequences:
Penalties under Environment (Protection) Act 1986, Section 15:
- Fines up to ₹1 lakh for initial violation
- Additional fines of ₹5,000 per day for continuing violations after conviction
- License suspension and production closure orders from SPCB/CPCB
- Case-by-case environmental compensation assessment (based on contamination extent and remediation costs, not a fixed per-tonne amount)
Extended Producer Responsibility (EPR) for Plastic & E-Waste
If your manufacturing involves plastic packaging, electronic components, or batteries, the Plastic Waste Management Rules 2016 and E-Waste Management Rules 2022 make you responsible for end-of-life disposal.
Plastic Waste EPR Penalties (if you’re a producer or brand owner):
- No EPR registration: ₹1–5 lakh fine + ₹10,000 per day for continuing violation
- Shortfall in recycling targets: ₹2,500–₹20,000 per tonne depending on violation count and material type
- False/late reporting: Up to ₹10 lakh with portal suspension
E-Waste Management Penalties(manufacturers & producers):
- 1st non-compliance: ₹20,000
- 2nd non-compliance: ₹40,000
- 3rd non-compliance: ₹80,000
- Plus continuing violation penalties of ₹10,000 per day under EPA 1986
License and operational impact: Non-compliance leads to CPCB portal suspension, inability to process vendor payments, and seizure of goods in extreme cases. A Bengaluru beverage exporter who missed their Q4 EPR filing faced a ₹3 lakh penalty, portal lockout, and ₹9 lakh in additional port demurrage charges before gaining compliance.
Customer Mandates Are Now Deal-Breakers
Tier 1 automotive OEMs including Maruti Suzuki, Tata Motors, and Mahindra are now requiring supplier waste certifications and environmental compliance proof before awarding contracts.
Standard requirements include:
- Scrap rates below 5%
- ISO 14001 Environmental Management Certification (mandatory, not optional)
- Documented waste disposal through authorized vendors
- IATF 16949 or equivalent automotive quality standards
Global automotive suppliers (BMW, Honda, Toyota) apply the same standards to their Indian supply chain. This means compliance isn’t just about Indian law—it’s about accessing global supply chains.
The commercial impact: Without ISO 14001 and documented EPR compliance, suppliers lose bidding eligibility on competitive tenders. OEMs simply won’t consider unregistered vendors, regardless of price or production capacity. Capacity constraints due to compliance failures force OEMs to shift sourcing to compliant competitors.
Banks Check Environmental Compliance During Loan Approval
When applying for working capital or expansion financing, banks now conduct environmental due diligence as part of MSME loan assessment (RBI MSME Policy 2022 onwards).
Required documents:
- Consent to Operate (CTO) from State Pollution Control Board (proof of operational compliance)
- Hazardous Waste Authorization (if applicable)
- EPR Registration Certificate (if producing plastic/e-waste products)
The approval process:
Banks require these documents before sanctioning loans. If your CPCB waste audit shows violations, loan approval is blocked until you remediate. The remediation cost – consultant fees, waste storage upgrades, authorized recycler contracts, and regulatory approvals – typically ranges from ₹2–5 lakh and takes 2–3 months.
The hidden cost of delays: During remediation, your capacity remains constrained, and existing customers may shift to compliant suppliers rather than wait. By the time you achieve compliance, you’ve lost contract opportunities that took years to build.
Waste Documentation Becomes Competitive Advantage
When you can document “Our scrap rate: 3.2% vs. industry average 8%” or “100% metal waste recycled through CPCB-authorized vendors” alongside ISO 14001 certification, you qualify for contracts that competitors without this documentation cannot bid for.
Suppliers with certified waste management systems are prioritized by OEMs for:
- Higher contract renewal rates
- Priority allocation during capacity expansions
- Access to higher-margin contracts (as OEMs can confidently commit to Tier 1 suppliers)
- Lower compliance auditing frequency (reducing operational disruption)
Why this matters: Sustainability became a commercial advantage around 2020 when customers, regulators, and banks started demanding documented proof rather than accepting verbal assurances. Compliance is no longer defensive cost management, it’s offensive competitive positioning.
Analyze Waste Like a Pro (SME-Friendly Techniques)
You just need three simple tools.
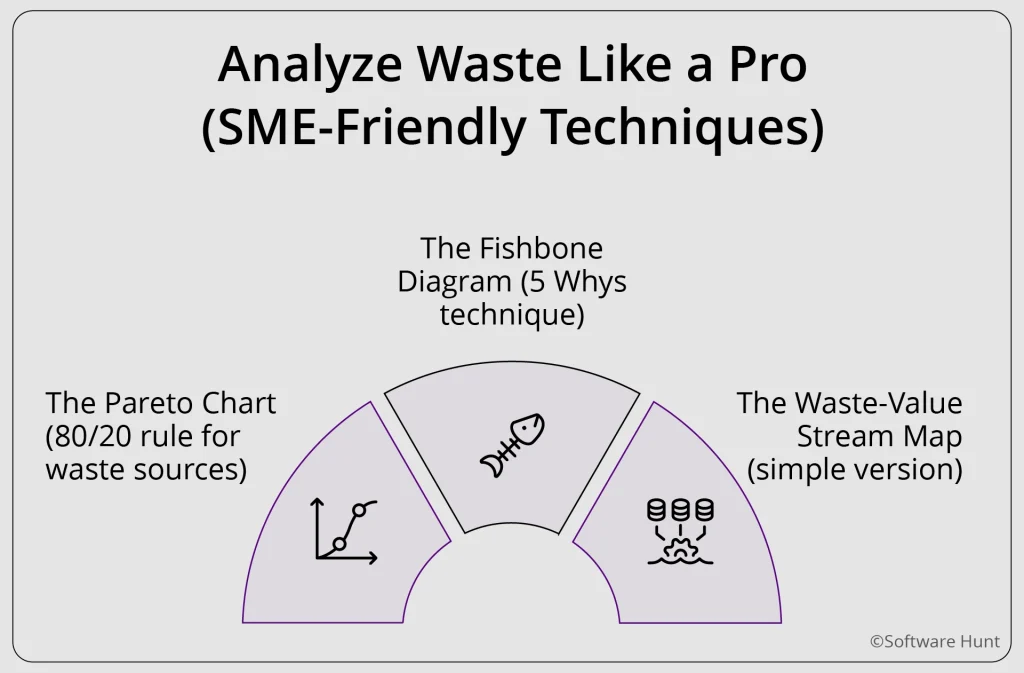
The Pareto Chart (80/20 rule for waste sources)
Step 1: List all waste sources (supplier, machine, operator, material, power).
Step 2: Count how many times each appears in your daily log.
Step 3: Sort descending.
Result: You’ll find 20% of sources cause 80% of waste. Focus there.
Example: Arvind found “Supplier material out of spec” appeared 18 times in a month. Everything else appeared 2-3 times. He focused on negotiating with that supplier. Waste dropped 40%.
The Fishbone Diagram (5 Whys technique)
Problem: “Why do we have 8 defects per shift?”
Why 1: “Because the cutting tool wears out.”
Why 2: “Because we don’t change it on schedule.”
Why 3: “Because we don’t have a schedule.”
Why 4: “Because we never tracked tool life.”
Why 5: “Because we didn’t think it mattered.”
Solution: Create a simple tool change schedule based on pieces cut. Defects dropped from 8/shift to 2/shift.
The Waste-Value Stream Map (simple version)
Draw your process: Raw Material → Cutting → Machining → Assembly → Finish.
Mark where waste happens at each step.
You’ll see that 60% of waste happens in 2 steps. Fix those first.
The map: Doesn’t have to be fancy. A whiteboard sketch works. The goal is visibility, not perfection.
5 Practical Ways to Reduce Waste in Manufacturing
Fix 1: 5S in 2 hours (not 2 days)
Don’t do a full 5S audit. Just do Sort and Set:
- Sort: Remove everything from the workstation that isn’t used daily. Put it in a red tag area.
- Set: Arrange tools in order of use. Label everything.
Cost: Zero.
Time: 2 hours per workstation.
Waste reduction: 15-20% in motion and waiting.
Fix 2: In-process quality check (one operator, one gauge)
Assign one operator per machine to check one critical dimension every 10 pieces. If it fails, stop the machine. Don’t wait for the end-of-line inspector.
Cost: One digital gauge (₹2,000).
Waste reduction: 70% fewer defects, 50% less rework.
Fix 3: Supplier quality agreement (not just price)
Add a clause: “Material out of spec by >3% will be returned at supplier’s cost. The supplier must compensate for production loss at ₹500/hour.”
Add a supplier quality agreement clause: ‘Material out of spec by >3% will be returned at supplier’s cost. The supplier must compensate for production loss at ₹500/hour for rework or downtime caused by quality issues.
Fix 4: The Kanban card (Post-It note system)
For your top 5 raw materials, stick a Post-It note on the bin: “Reorder when this card is visible.” No Excel. No complex calculations. Just visual signals.
Cost: ₹50 for Post-Its.
Waste reduction: 25% less overproduction and inventory.
Fix 5: Weekly 30-minute skill-share (peer training at shift change)
Every Friday during shift handover, your best operator demonstrates one technique to 4-5 peers: checking tool wear, proper torque sequence, or spotting weld defects. Make it hands-on, rotate instructors weekly, take one photo for documentation. Human error causes 15-23% of manufacturing defects, and peer mentoring produces better skill retention than classroom training.
Cost: ₹0 (done during paid shift time)
Waste reduction: 10-15% fewer operator-error defects within 3-4 months
What Good Waste Tracking Looks Like (The ₹0 Tool)
The WhatsApp + Excel + Tally Combo:
- WhatsApp: Supervisor posts daily waste photo with caption “Steel scrap: 15 kg, Defects: 8 pcs, Time waste: 1.5 hours.”
- Excel: Ops head maintains a simple sheet: Date | Waste Type | Quantity | Reason | Cost. Updates weekly. It takes 10 minutes.
- Tally: Create a “Waste” stock item. Every week, create a stock journal: RM → Waste. Value = quantity × purchase rate.
Result: At month-end, you have a Tally report: “Total waste value = ₹1.8 lakh.” That’s your baseline. That’s your starting point for improvement.
Why SoftwareHunt?
We’re SoftwareHunt. We work with manufacturing owners running on Tally, Excel, and lean teams to understand your operational leaks and growth challenges. We go beyond platform listings to help you find the right solution at no cost to you.
We’ll help you translate symptoms into clear financial insight and show you where to focus first – at no cost to you.
To email an advisor for a quick fit-check write to us at connect@softwarehunt.com