TL;DR
- Manufacturing inventory accuracy averages 75-80%.
- The 8-stage system catches problems at source: planning, receiving verification, storage, consumption tracking, cycle counting, replenishment, reporting, and compliance.
- Implement ABC classification today. Calculate reorder points. Create receiving checklist. Update consumption same-day. Map warehouse.
- Formulas for safety stock and carrying costs included.
Most manufacturing leaders will tell you their inventory accuracy is “acceptable.”
What they really mean is they haven’t measured it.
The data tells a different story. Research shows that 58% of manufacturers and brands have inventory accuracy below 80%.
That gap between what your system says you have and what’s actually on the shelf is costing you more than you think.
Let’s be concrete. If you have ₹5 crore in raw materials inventory and your accuracy is 75%, then ₹1.25 crore of that inventory is phantom, misplaced, or untracked. That’s cash bleeding out of your operation.
Where the Real Problems Show Up
Production delays you can’t explain.
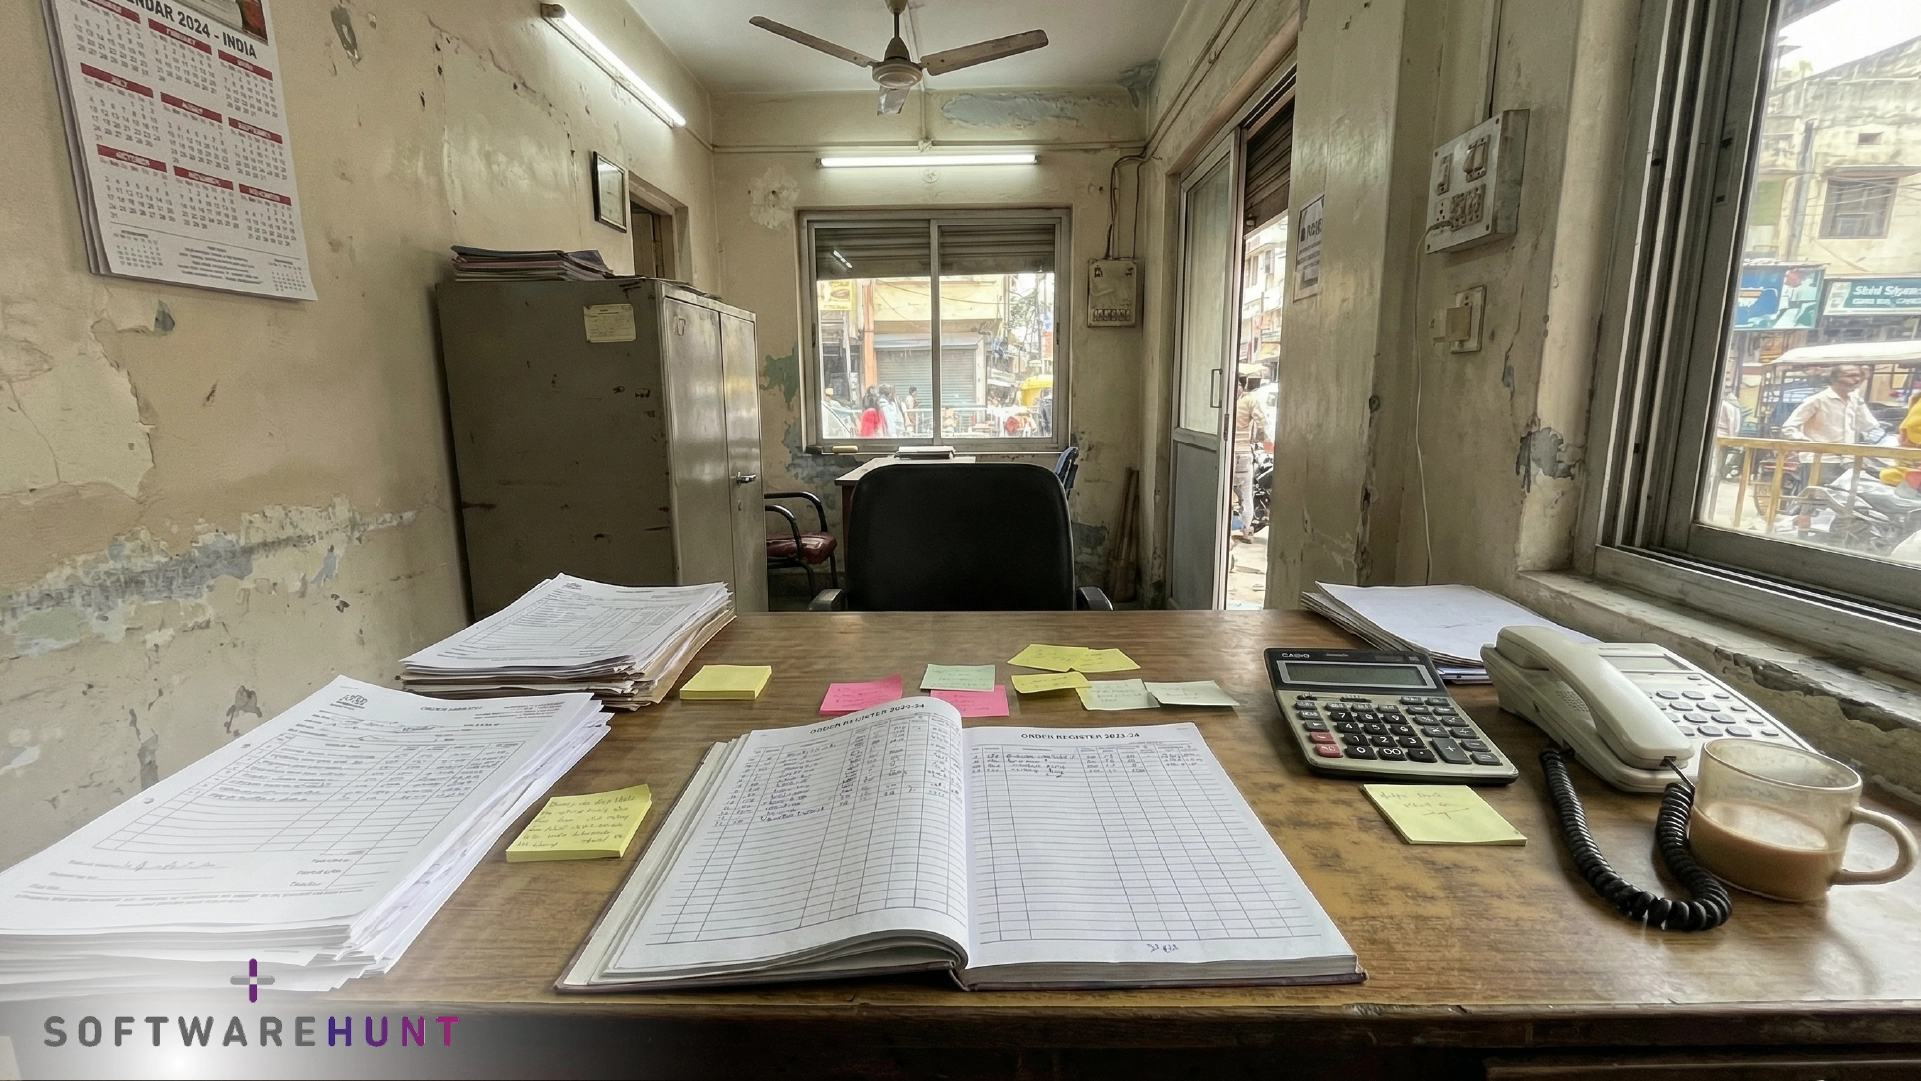
Your team needs Material X. The system says you have 500 units in stock. But when they check the warehouse, it’s not there. Or it’s in the wrong location. Or it’s damaged. Instead of producing, your team spends hours searching. Production delays. Machines sit idle. Customers wait.
Excess safety stock you don’t need.
Because you don’t trust your inventory numbers, you order more than you actually need. You carry extra buffer stock “just in case.” That excess inventory costs 15-35 percent of its value every year just to store, insure, and manage. For a ₹20 lakh excess inventory, that’s ₹3-7 lakhs wasted annually.
Emergency orders that cost too much.
When inventory discrepancies create surprise shortages, you panic-order from suppliers at premium rates – 30-50% more expensive than normal procurement. Your procurement team spends time firefighting instead of negotiating better deals.
Dead stock and write-offs.
Items sit on shelves longer than they should. They age, degrade, expire. When you finally dispose of them, that’s a sunk cost. Obsolete inventory is pure loss.
Labor costs that drain efficiency.
Your warehouse team spends hours searching for inventory, reconciling discrepancies, and correcting system records. That labor could go toward value-added work instead. Constant firefighting mode reduces overall productivity.
This guide walks you through the 8-stage inventory control system that separates manufacturers who fix accuracy problems from those who ignore them.
Let’s start.
The 8-Stage Inventory Control Framework
Think of your inventory like water flowing through a pipe. It starts at planning, flows through receiving, gets stored, gets consumed, gets monitored, gets replenished, and gets reported on.
If any stage leaks, the whole system fails.
Most manufacturers focus only on one or two stages (usually storage and counting). The best ones manage all eight.

Stage 1: Stock Planning and Forecasting
This is where the leak often starts.
You forecast demand based on historical sales. But you don’t adjust for seasonality. You don’t factor in planned production campaigns. You don’t involve both your sales and operations teams. So you end up with either too much stock or too little.
The fix is simple: Set minimum and maximum stock levels based on real demand data, not guesses. For your highest-value items (Class A items), review forecasts monthly. Adjust for seasonality. Align production schedules with procurement plans.
Quick question: Do both your sales and production teams agree on the demand forecast, or is it just something the planner created in isolation?
Stage 2: Receiving and Verification
This is where bad inventory sneaks in.
Materials arrive. Someone scans them. They get stored. Then, three weeks later, quality discovers they’re out of spec. Or a production team finds they’re the wrong size. Or they start deteriorating because storage conditions were wrong.
The damage is already done. They’re now in your system as good inventory.
The fix is brutal and simple: Verify everything at receiving. Check quantity against purchase order. Do visual inspections for damage. Test samples for quality. Record lot numbers and expiration dates. Segregate anything questionable and investigate before it enters the warehouse.
Companies that implemented this reported 15-20 % fewer downstream quality issues.
Quick question: When materials arrive, does someone verify them against the PO, or do they just unload and scan?
Stage 3: Storage and Organization
Your warehouse layout determines how fast materials disappear and how long employees waste searching.
Materials scattered randomly. No FIFO (First-In-First-Out) discipline. High-demand items buried in the back. Obsolete items still on shelves. This creates chaos.
The fix: Organize your warehouse into zones. Receiving, staging, picking, packing. Map it. Label everything. Put fast-moving items in easy-to-access locations. Remove obsolete stuff. Follow FIFO religiously.
Companies that did this cut search time by 30-40 %.
Quick question: If I ask a random employee where Material X is stored, can they point to it in 30 seconds, or do they need to walk around checking?
Stage 4: Stock Issuing and Usage
Production pulls materials. But when do they actually consume them?
Here’s the leak: Production pulls material and immediately uses it. But the system update doesn’t happen until end-of-day. Or sometimes the next day. By then, the system still shows stock available that’s already been used. Production schedules are made based on phantom inventory. Purchasing buys more because the system says you need it. Discrepancies build.
The fix: Update consumption in real-time or same-day. Use simple material issue forms. Have supervisors sign off. Track consumption by production order, not just by day. Separate scrap from normal consumption.
Quick question: When production uses raw materials, does your system update within the same day, or is it batched with a 2-3 day lag?
We’re SoftwareHunt. Our team sits with manufacturing owners to understand your operational leaks and growth challenges. We go beyond platform listings to help you find the right solution at no cost to you.
Email an advisor for a quick fit-check write to us at connect@softwarehunt.com
Stage 5: Stock Monitoring and Control
This is the stage most manufacturers skip entirely.
Monitoring means regular counts. Cycle counting, specifically. Not annual counts. Monthly counts for high-value items. Quarterly for low-value items.
Why? Because annual counts reveal problems that happened nine months ago. By then, they’ve cascaded. Monthly cycle counts catch issues early.
The math is simple:
(Physical Count ÷ System Count) × 100 = Accuracy %
Target 97 % for high-value items. Anything below that signals a process problem.
When you find a discrepancy, don’t just adjust the system. Investigate. Is it a counting error? A theft? A system error? Damaged goods? Each cause needs different prevention.
Companies that do monthly cycle counts on Class A items catch problems 12 times faster than those doing annual full counts.
Quick question: When was the last time you counted your highest-value items and compared them to your system? If the answer is “we do annual inventory,” you’re losing millions.
Stage 6: Stock Replenishment
This is where science meets reality.
You need a reorder point. The formula is simple:
(Average Daily Usage × Lead Time) + Safety Stock
Example: You use 10 units of Material X daily. Your supplier’s lead time is 14 days. You want 140 units of safety stock for variability. Your ROP = (10 × 14) + 140 = 280 units.
Place a new order when stock hits 280. Not when it hits zero. Not when you “feel like” you need it.
The second critical number is safety stock. How much buffer do you actually need? That depends on demand variability and supplier reliability. Most manufacturers carry way too much safety stock because they don’t trust their numbers. Better inventory control means tighter safety stock. Tighter safety stock means less cash tied up.
Quick question: For your top 10 materials, do you know the reorder point? Can you calculate it, or is reordering based on “we’re getting low”?
Stage 7: Reporting and Analysis
Here’s what manufacturing leaders actually need to track monthly:
Inventory Turnover Ratio = COGS ÷ Average Inventory. Example: If you spend ₹50 lakh on materials and hold ₹10 lakh in average inventory, your ratio is 5. You replace inventory five times per year. Below 3 means you’re overstocking.
Days on Hand = (Average Inventory ÷ COGS) × 365. How many days can your current inventory sustain operations? Fewer days is better; less cash tied up.
Carrying Cost = Inventory Value × 18-25 % (annual). This is how much excess inventory is costing you per year. ₹20 lakh inventory × 18 % = ₹3.6 lakh annual waste.
Cycle Count Accuracy = (Physical Count ÷ System Count) × 100. Are your records reliable?
If you’re not calculating these monthly, you’re flying blind.
Quick question: Do you know your inventory turnover ratio and days on hand? If someone asked you right now, could you say it, or would you need to dig through reports?
Stage 8: Compliance and Continuous Improvement
Finally, you need documented procedures. Training records. Quarterly internal audits. Corrective action tracking.
This isn’t bureaucracy. This is preventing the same mistakes from repeating.
Most manufacturers operate on tribal knowledge. “John knows where everything is stored.” “Sarah handles receiving.” Then John leaves. Sarah retires. The system collapses.
Document your procedures. Train your people. Audit quarterly. Fix what’s broken.
The Quick Wins You Can Implement This Week
You don’t need a software upgrade to get from 77 % to 90 % accuracy. You need execution.

Quick Win 1: ABC Classification (2 hours)
List all your inventory by annual consumption value. Top 20 % = Class A (high-value). Next 30 % = Class B. Bottom 50 % = Class C. Now you know where to focus effort. Count Class A items monthly. Class B bi-monthly. Class C quarterly. This alone cuts counting effort by 40 %.
Quick Win 2: Reorder Points (3 hours)
Pick your 10 highest-value materials. Calculate ROP for each: (Average Daily Usage × Lead Time) + Safety Stock. Enter these into your system. Set alerts. This prevents stockouts and emergency orders.
Quick Win 3: Baseline Cycle Count (4 hours)
Count 20 high-value items today. Compare to system. Investigate the top 5 discrepancies. You’ll immediately see where the biggest leaks are.
Quick Win 4: Receiving Checklist (1 hour)
Print a simple checklist. Post it at the receiving dock. Verify quantity, check quality, record lot numbers. This prevents bad stock from contaminating your warehouse.
Quick Win 5: Warehouse Reorganization (1 day)
Map your warehouse. Move fast-moving items to easy access. Label everything. Remove dead stock. This cuts search time dramatically.
Total investment: <₹10,000. Total time: <3 days. Expected improvement: 10-15 % accuracy gain within 60 days.
The System Is More Important Than the Technology
Here’s what separates manufacturers who fix inventory problems from those who don’t:
Manufacturers who fail think the problem is a counting problem. So they count more. Or they buy better counting tools. Discrepancies persist because counting isn’t the bottleneck.
Manufacturers who succeed realize the problem is a system problem. They establish a repeatable process. They document procedures. They train people. They monitor and audit. They fix root causes, not just adjust numbers.
What Gets Measured Gets Managed
Stop managing inventory as a storage problem.
Start managing it as a cash flow problem. Excess inventory is cash in a warehouse. Phantom inventory is cash you’ve lost. Stockouts are cash you never made because you couldn’t fulfill orders.
Calculate how much cash is tied up in inventory. Calculate your carrying cost. Calculate your stockout losses. Put those numbers in front of leadership monthly.
When inventory becomes a P&L line item, behavior changes. Accuracy improves. Systems tighten.
The eight-stage framework gives you visibility at each step. The quick wins give you immediate results. The technology decision framework tells you whether spreadsheet or software makes sense for your scale.
But the real shift comes from treating inventory control as a system, not a function.
That shift is the difference between 77 % accuracy and 97 %.
And that difference is worth crore.
The first step is knowing where you stand. If you haven’t done a baseline cycle count on your high-value items in the past 30 days, you don’t know your actual accuracy. Start there. Count 20 items. Compare to system. That one data point tells you everything.
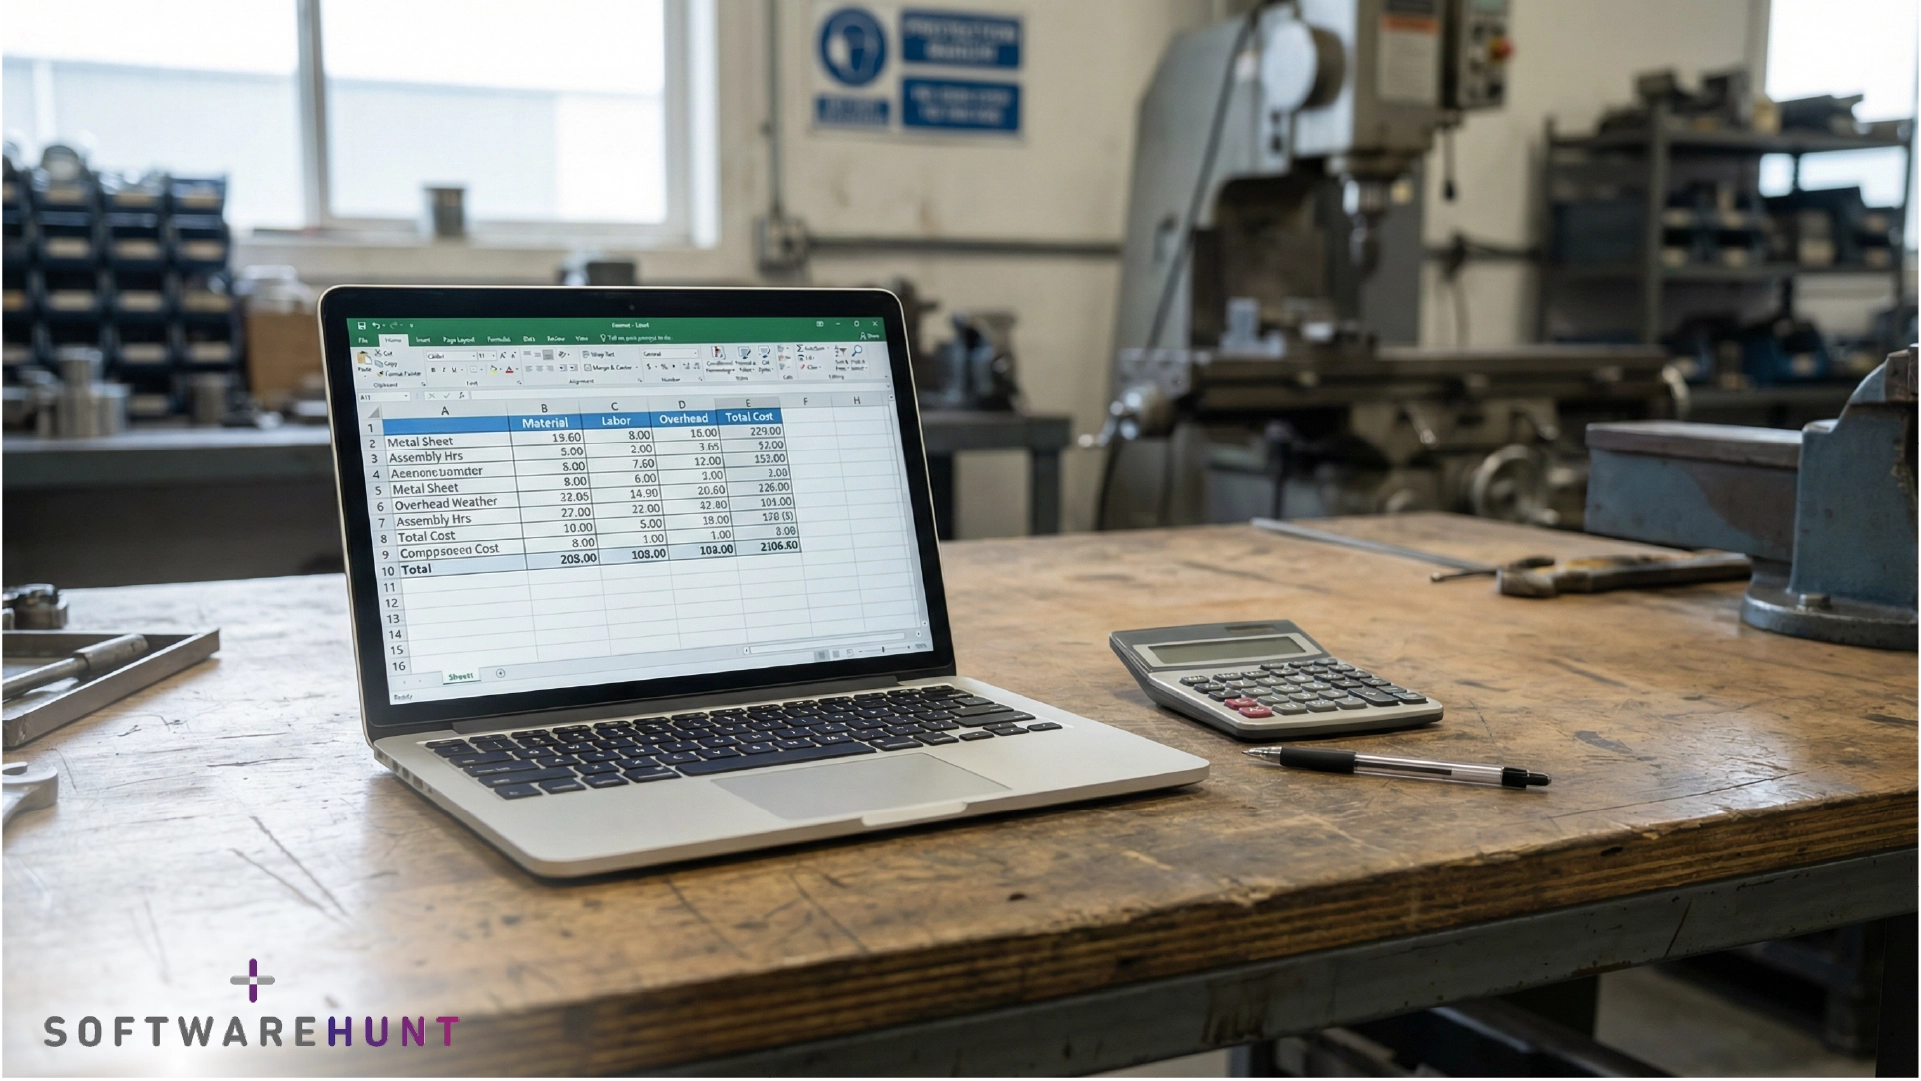
We’re SoftwareHunt. We work with manufacturing owners running on Tally, Excel, and lean teams to understand your operational leaks and growth challenges. Our team is happy to connect with you, understand your personal pain points, operational leaks and growth challenges and go beyond platform listings/information to help find the right solution for you.
We’ll help you translate symptoms into clear financial insight and show you where to focus first – at no cost to you.
To email an advisor for a quick fit-check write to us at connect@softwarehunt.com.